Answered step by step
Verified Expert Solution
Link Copied!

Question

1 Approved Answer

6 Hundred and one cities provided information on vacancy rates (in percent) in local apartments in the following frequency distribution. The sample mean and the
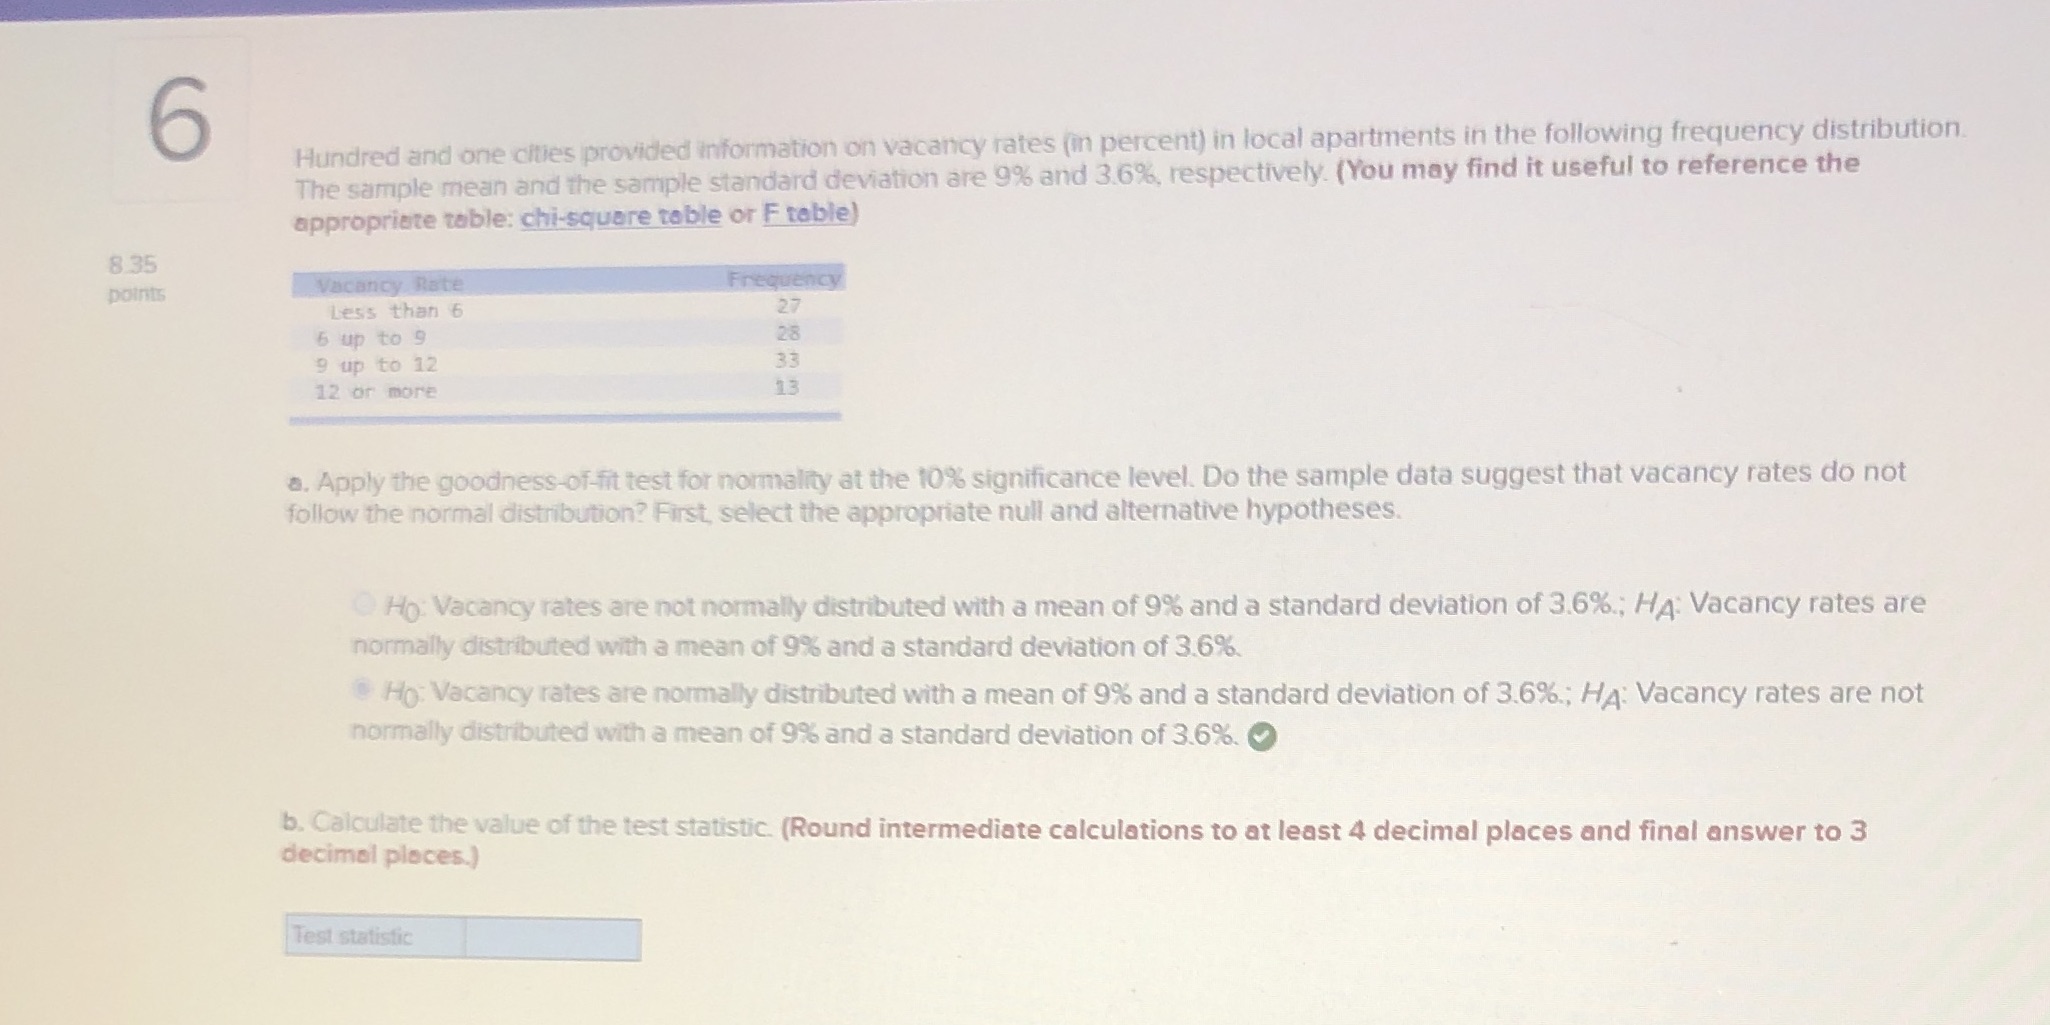
image text in transcribed
6 Hundred and one cities provided information on vacancy rates (in percent) in local apartments in the following frequency distribution. The sample mean and the sample standard deviation are 9% and 3.6% respectively. (You may find it useful to reference the appropriate table: chi-square table or F table) 8 35 points Vacancy Rate Frequency Less than 6 27 6 up to 9 28 9 up to 12 33 12 or more 13 a. Apply the goodness-of-fit test for normality at the 10% significance level. Do the sample data suggest that vacancy rates do not follow the normal distribution? First, select the appropriate null and alternative hypotheses. Ho: Vacancy rates are not normally distributed with a mean of 9% and a standard deviation of 3.6%.; HA: Vacancy rates are normally distributed with a mean of 9% and a standard deviation of 3.6%. Ho: Vacancy rates are normally distributed with a mean of 9% and a standard deviation of 3.6%.; HA: Vacancy rates are not normally distributed with a mean of 9% and a standard deviation of 3.6%. decimal places.) b. Calculate the value of the test statistic. (Round intermediate calculations to at least 4 decimal places and final answer to 3 Test statistic

Step by Step Solution

There are 3 Steps involved in it

Step: 1

blur-text-image

Get Instant Access to Expert-Tailored Solutions

See step-by-step solutions with expert insights and AI powered tools for academic success

Step: 2

blur-text-image

Step: 3

blur-text-image

Ace Your Homework with AI

Get the answers you need in no time with our AI-driven, step-by-step assistance

Get Started

Recommended Textbook for

Advanced Engineering Mathematics

Authors: ERWIN KREYSZIG

9th Edition

0471488852, 978-0471488859

More Books

Students also viewed these Mathematics questions