Answered step by step
Verified Expert Solution
Question
1 Approved Answer
6. In this exercise, we are going to examine the average return and volatility of the NASDAQ Composite index. Go to the webpage https://finance.yahoo.com.

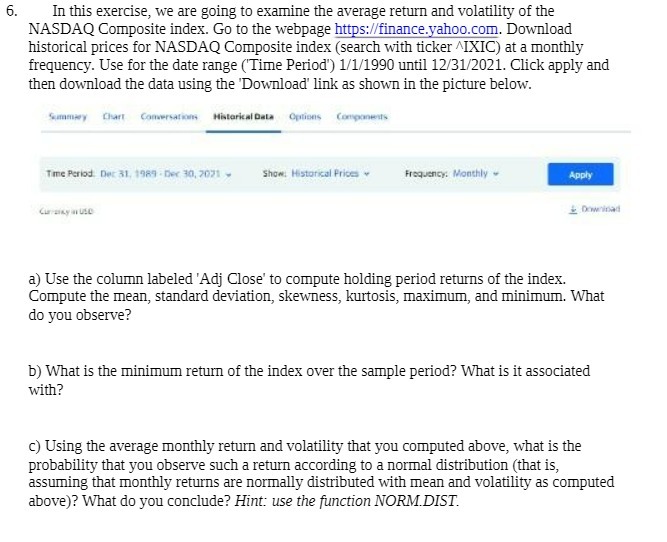
6. In this exercise, we are going to examine the average return and volatility of the NASDAQ Composite index. Go to the webpage https://finance.yahoo.com. Download historical prices for NASDAQ Composite index (search with ticker ^IXIC) at a monthly frequency. Use for the date range (Time Period') 1/1/1990 until 12/31/2021. Click apply and then download the data using the 'Download' link as shown in the picture below. Summary Chart Conversations Historical Data Options Components Time Period Dec 31, 1989-Dec 30, 2021 Show. Historical Prices Frequency: Monthly Apply Downinad a) Use the column labeled 'Adj Close' to compute holding period returns of the index. Compute the mean, standard deviation, skewness, kurtosis, maximum, and minimum. What do you observe? b) What is the minimum return of the index over the sample period? What is it associated with? c) Using the average monthly return and volatility that you computed above, what is the probability that you observe such a return according to a normal distribution (that is, assuming that monthly returns are normally distributed with mean and volatility as computed above)? What do you conclude? Hint: use the function NORM.DIST.
Step by Step Solution
There are 3 Steps involved in it
Step: 1

Get Instant Access to Expert-Tailored Solutions
See step-by-step solutions with expert insights and AI powered tools for academic success
Step: 2

Step: 3

Ace Your Homework with AI
Get the answers you need in no time with our AI-driven, step-by-step assistance
Get Started


