Answered step by step
Verified Expert Solution
Question
1 Approved Answer
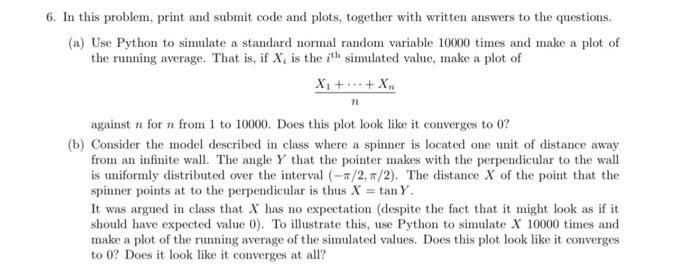
6. In this problem, print and submit code and plots, together with written answers to the questions. (a) Use Python to simulate a standard

6. In this problem, print and submit code and plots, together with written answers to the questions. (a) Use Python to simulate a standard normal random variable 10000 times and make a plot of the running average. That is, if X, is the ith simulated value, make a plot of n against n for n from 1 to 10000. Does this plot look like it converges to 0? (b) Consider the model described in class where a spinner is located one unit of distance away from an infinite wall. The angle Y that the pointer makes with the perpendicular to the wall is uniformly distributed over the interval (-/2, /2). The distance X of the point that the spinner points at to the perpendicular is thus Xtan Y. It was argued in class that X has no expectation (despite the fact that it might look as if it should have expected value 0). To illustrate this, use Python to simulate X 10000 times and make a plot of the running average of the simulated values. Does this plot look like it converges to 0? Does it look like it converges at all?
Step by Step Solution
There are 3 Steps involved in it
Step: 1

Get Instant Access to Expert-Tailored Solutions
See step-by-step solutions with expert insights and AI powered tools for academic success
Step: 2

Step: 3

Ace Your Homework with AI
Get the answers you need in no time with our AI-driven, step-by-step assistance
Get Started


