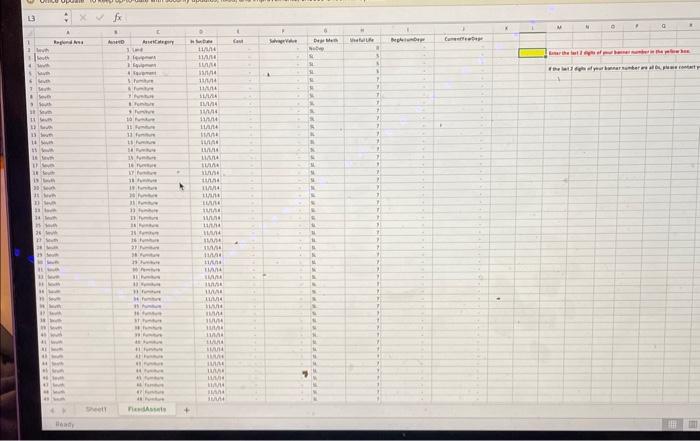
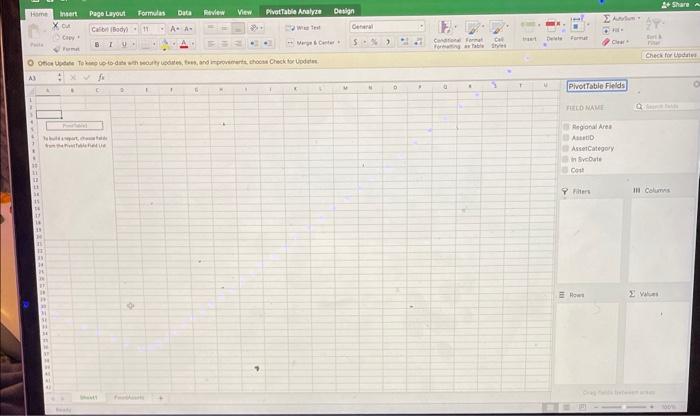
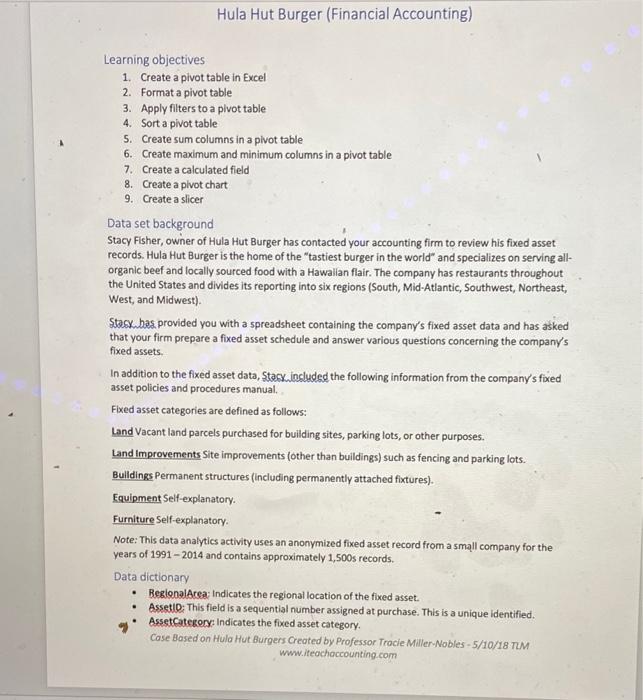
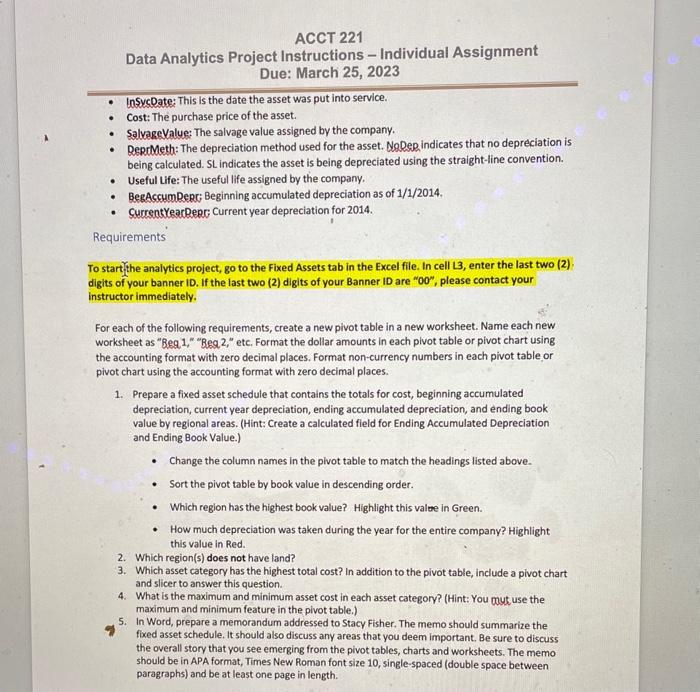
. 6 . Pivotrobie Finids Fing onal Are t Mititio AssetCategory his brobte cots Paiers 113 Gelumes (2) Yaser Hula Hut Burger (Financial Accounting) Learning objectives 1. Create a pivot table in Excel 2. Format a pivot table 3. Apply filters to a plvot table 4. Sort a pivot table 5. Create sum columns in a plivot table 6. Create maximum and minimum columns in a pivot table 7. Create a calculated field 8. Create a plvot chart 9. Create a slicer Data set background Stacy Fisher, owner of Hula Hut Burger has contacted your accounting firm to review his fixed asset records. Hula Hut Burger is the home of the "tastiest burger in the world" and specializes on serving allorganic beef and locally sourced food with a Hawalian flair. The company has restaurants throughout the United States and divides its reporting into six regions (South, Mid-Atlantic, Southwest, Northeast, West, and Midwest). Stacxy bas provided you with a spreadsheet containing the company's fixed asset data and has asked that your firm prepare a fixed asset schedule and answer various questions concerning the company's fixed assets. In addition to the fixed asset data, Stacy included the following information from the company's fixed asset policies and procedures manual. Fixed asset categories are defined as follows: Land Vacant land parcels purchased for building sites, parking lots, or other purposes. Land Improvements Site improvements (other than buildings) such as fencing and parking lots. Bulldings Permanent structures (including permanently attached fixtures). Equipment Self-explanatory. Furniture Self-explanatory. Note: This data analytics activity uses an anonymized fixed asset record from a smll company for the years of 19912014 and contains approximately 1,500 s records. Data dictionary - BegionalArea Indicates the regional location of the fixed asset. - AssetiD: This fleld is a sequential number assigned at purchase. This is a unique identified. of. AssetCategery: Indicates the fixed asset category. Case Based on Hulla Hut Burgers Created by Professor Trocie Miller-Nobles - 5/10/18 TLM wiw.iteochaccounting com ACCT 221 Data Analytics Project Instructions - Individual Assignment Due: March 25, 2023 - InsucDate: This is the date the asset was put into service. - Cost: The purchase price of the asset. - SalvageValue: The salvage value assigned by the company. - Reprleth: The depreciation method used for the asset. NoQep indicates that no depreciation is being calculated. SL indicates the asset is being depreciated using the straight-line convention. - Useful Life: The useful life assigned by the company. - BegAccumpepc Beginning accumulated depreciation as of 1/1/2014. - CurrentYearRear Current year depreciation for 2014. Requirements To start\}the analytics project, go to the Fixed Assets tab in the Excel file. In cell 13 , enter the last two (2) digits of your banner 10 . If the last two (2) digits of your Banner ID are "00", please contact your instructor immediately. For each of the following requirements, create a new pivot table in a new worksheet. Name each new worksheet as "Beq 1," "Beg 2," etc. Format the dollar amounts in each pivot table or pivot chart using the accounting format with zero decimal places. Format non-currency numbers in each pivot table or pivot chart using the accounting format with zero decimal places. 1. Prepare a fixed asset schedule that contains the totals for cost, beginning accumulated depreciation, current year depreciation, ending accumulated depreciation, and ending book value by regional areas. (Hint: Create a calculated fleld for Ending Accumulated Depreciation and Ending Book Value.) - Change the column names in the plvot table to match the headings listed above. - Sort the pivot table by book value in descending order. - Which region has the highest book value? Highlight this value in Green. - How much depreciation was taken during the year for the entire company? Highlight this value in Red. 2. Which region(s) does not have land? 3. Which asset category has the highest total cost? In addition to the pivot table, include a pivot chart and slicer to answer this question. 4. What is the maximum and minimum asset cost in each asset category? (Hint: You mut use the maximum and minimum feature in the pivot table.) 5. In Word, prepare a memorandum addressed to Stacy Fisher. The memo should summarize the fixed asset schedule. It should also discuss any areas that you deem important. Be sure to discuss the overall story that you see emerging from the pivot tables, charts and worksheets. The memo should be in APA format, Times New Roman font size 10, single-spaced (double space between paragraphs) and be at least one page in length. . 6 . Pivotrobie Finids Fing onal Are t Mititio AssetCategory his brobte cots Paiers 113 Gelumes (2) Yaser Hula Hut Burger (Financial Accounting) Learning objectives 1. Create a pivot table in Excel 2. Format a pivot table 3. Apply filters to a plvot table 4. Sort a pivot table 5. Create sum columns in a plivot table 6. Create maximum and minimum columns in a pivot table 7. Create a calculated field 8. Create a plvot chart 9. Create a slicer Data set background Stacy Fisher, owner of Hula Hut Burger has contacted your accounting firm to review his fixed asset records. Hula Hut Burger is the home of the "tastiest burger in the world" and specializes on serving allorganic beef and locally sourced food with a Hawalian flair. The company has restaurants throughout the United States and divides its reporting into six regions (South, Mid-Atlantic, Southwest, Northeast, West, and Midwest). Stacxy bas provided you with a spreadsheet containing the company's fixed asset data and has asked that your firm prepare a fixed asset schedule and answer various questions concerning the company's fixed assets. In addition to the fixed asset data, Stacy included the following information from the company's fixed asset policies and procedures manual. Fixed asset categories are defined as follows: Land Vacant land parcels purchased for building sites, parking lots, or other purposes. Land Improvements Site improvements (other than buildings) such as fencing and parking lots. Bulldings Permanent structures (including permanently attached fixtures). Equipment Self-explanatory. Furniture Self-explanatory. Note: This data analytics activity uses an anonymized fixed asset record from a smll company for the years of 19912014 and contains approximately 1,500 s records. Data dictionary - BegionalArea Indicates the regional location of the fixed asset. - AssetiD: This fleld is a sequential number assigned at purchase. This is a unique identified. of. AssetCategery: Indicates the fixed asset category. Case Based on Hulla Hut Burgers Created by Professor Trocie Miller-Nobles - 5/10/18 TLM wiw.iteochaccounting com ACCT 221 Data Analytics Project Instructions - Individual Assignment Due: March 25, 2023 - InsucDate: This is the date the asset was put into service. - Cost: The purchase price of the asset. - SalvageValue: The salvage value assigned by the company. - Reprleth: The depreciation method used for the asset. NoQep indicates that no depreciation is being calculated. SL indicates the asset is being depreciated using the straight-line convention. - Useful Life: The useful life assigned by the company. - BegAccumpepc Beginning accumulated depreciation as of 1/1/2014. - CurrentYearRear Current year depreciation for 2014. Requirements To start\}the analytics project, go to the Fixed Assets tab in the Excel file. In cell 13 , enter the last two (2) digits of your banner 10 . If the last two (2) digits of your Banner ID are "00", please contact your instructor immediately. For each of the following requirements, create a new pivot table in a new worksheet. Name each new worksheet as "Beq 1," "Beg 2," etc. Format the dollar amounts in each pivot table or pivot chart using the accounting format with zero decimal places. Format non-currency numbers in each pivot table or pivot chart using the accounting format with zero decimal places. 1. Prepare a fixed asset schedule that contains the totals for cost, beginning accumulated depreciation, current year depreciation, ending accumulated depreciation, and ending book value by regional areas. (Hint: Create a calculated fleld for Ending Accumulated Depreciation and Ending Book Value.) - Change the column names in the plvot table to match the headings listed above. - Sort the pivot table by book value in descending order. - Which region has the highest book value? Highlight this value in Green. - How much depreciation was taken during the year for the entire company? Highlight this value in Red. 2. Which region(s) does not have land? 3. Which asset category has the highest total cost? In addition to the pivot table, include a pivot chart and slicer to answer this question. 4. What is the maximum and minimum asset cost in each asset category? (Hint: You mut use the maximum and minimum feature in the pivot table.) 5. In Word, prepare a memorandum addressed to Stacy Fisher. The memo should summarize the fixed asset schedule. It should also discuss any areas that you deem important. Be sure to discuss the overall story that you see emerging from the pivot tables, charts and worksheets. The memo should be in APA format, Times New Roman font size 10, single-spaced (double space between paragraphs) and be at least one page in length
