

Question
(6 points; Chapter 8.1 ) In an observational study, data about 100 diamond rings was collected, including the variables carat of the diamond (a measure
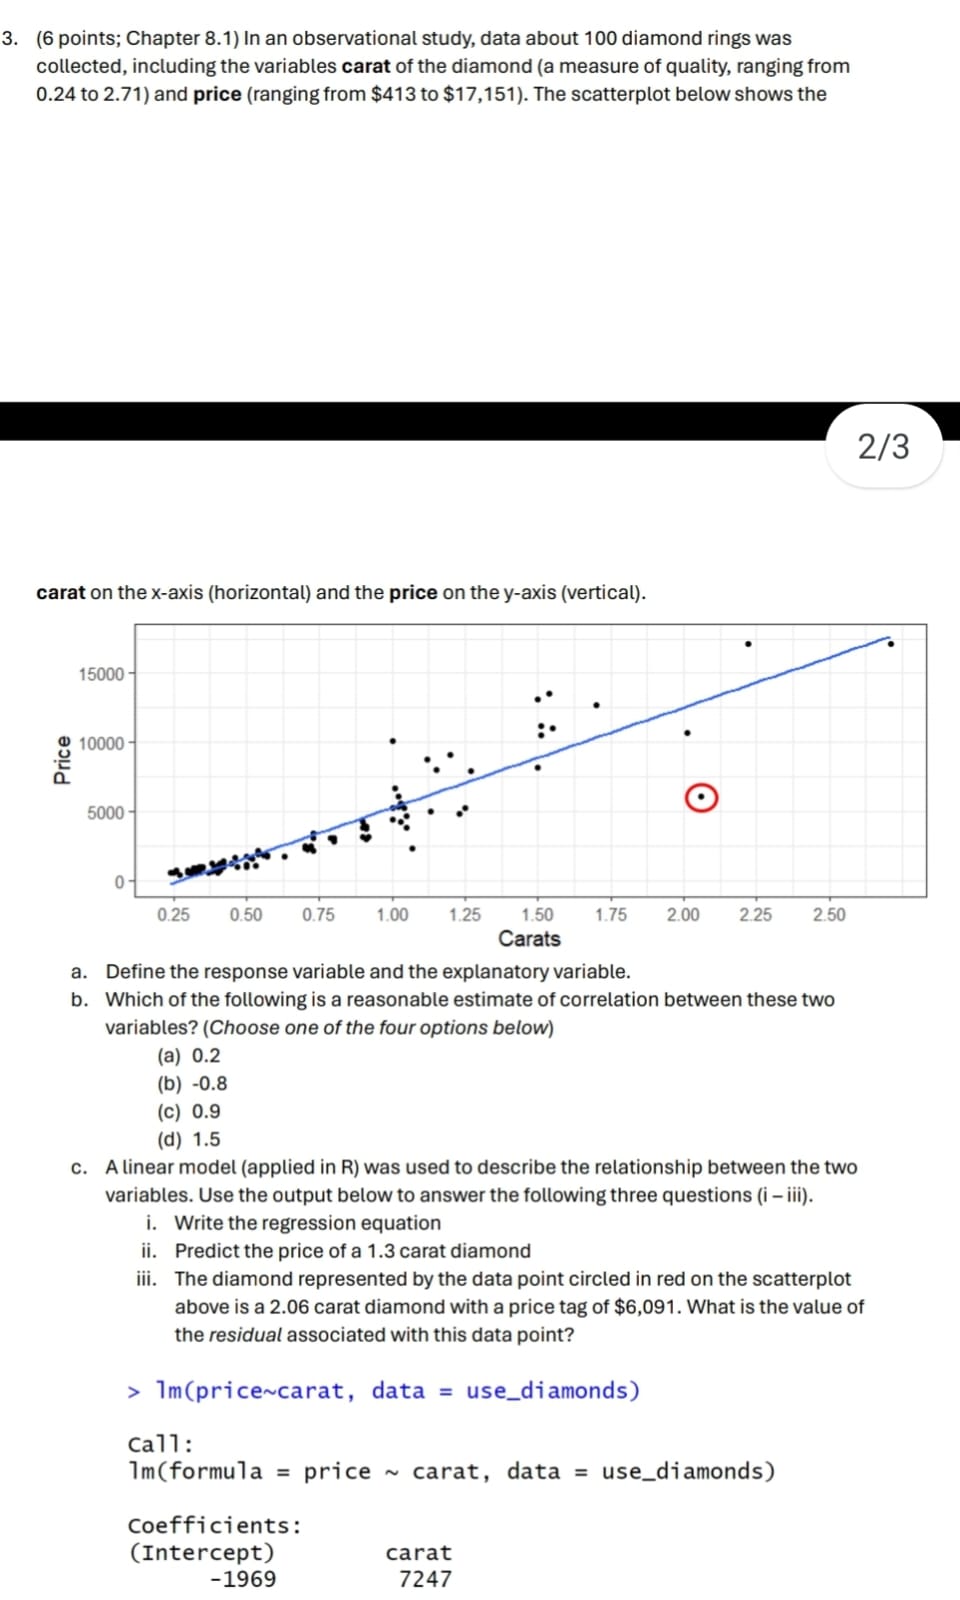
(6 points; Chapter 8.1 ) In an observational study, data about 100 diamond rings was\ collected, including the variables carat of the diamond (a measure of quality, ranging from\ 0.24 to 2.71 ) and price (ranging from
$413to
$17,151). The scatterplot below shows the\ carat on the x-axis (horizontal) and the price on the v-axis (vertical).\ a. Define the response variable and the explanatory variable.\ b. Which of the following is a reasonable estimate of correlation between these two\ variables? (Choose one of the four options below)\ (a) 0.2\ (b) -0.8\ (c) 0.9\ (d) 1.5\ c. A linear model (applied in R) was used to describe the relationship between the two\ variables. Use the output below to answer the following three questions (i-iii).\ i. Write the regression equation\ ii. Predict the price of a 1.3 carat diamond\ iii. The diamond represented by the data point circled in red on the scatterplot\ above is a 2.06 carat diamond with a price tag of
$6,091. What is the value of\ the residual associated with this data point?\
>1m(price carat, data
=use_diamonds)\ Ca11:\ 1m(formula = price
carat, data
=use_diamonds)\ Coefficients:\ (Intercept)\ carat\
-1969\ 7247
Step by Step Solution
There are 3 Steps involved in it
Step: 1

Get Instant Access to Expert-Tailored Solutions
See step-by-step solutions with expert insights and AI powered tools for academic success
Step: 2

Step: 3
Ace Your Homework with AI
Get the answers you need in no time with our AI-driven, step-by-step assistance
Get Started
Constraint Databases And Applications Second International Workshop On Constraint Database Systems Cdb 97 Delphi Greece January 1997 Cp 96 Workshop On Constraints And Databases Cambridge Ma Usa August 1996 Selected Papers Lncs 1191
Authors: Volker Gaede ,Alexander Brodsky ,Oliver Gunther ,Divesh Srivastava
1st Edition