Answered step by step
Verified Expert Solution
Link Copied!

Question

1 Approved Answer

6. Sales (in $) for one week were collected for 18 stores in a food store chain. The data are shown below. The stores and
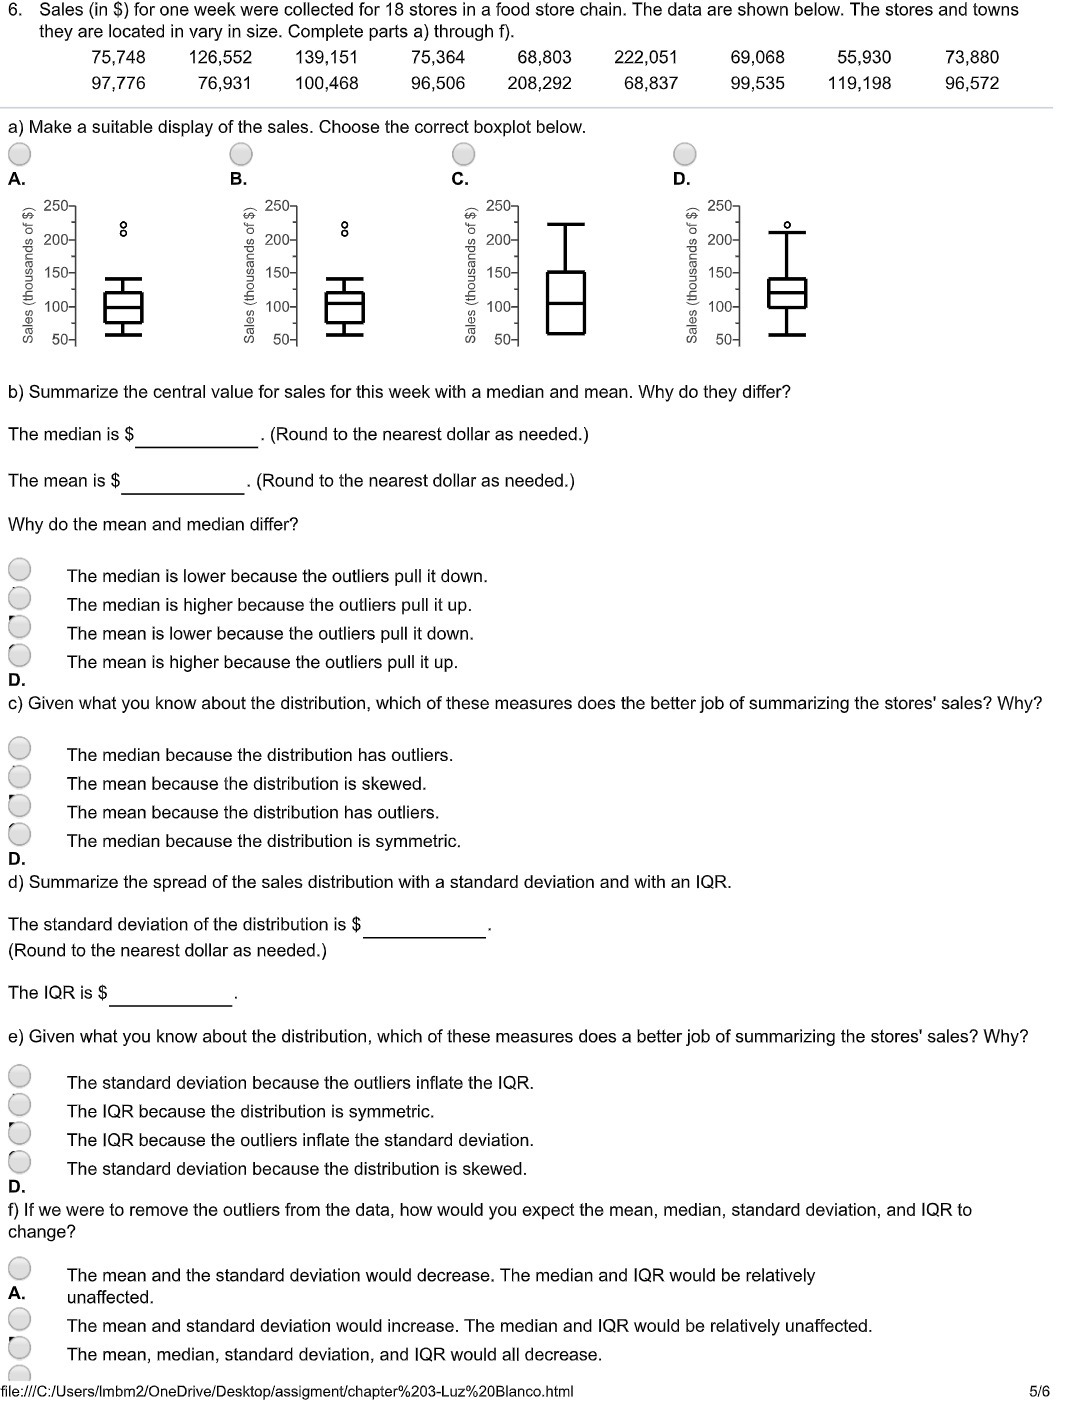
image text in transcribed
6. Sales (in $) for one week were collected for 18 stores in a food store chain. The data are shown below. The stores and towns they are located in vary in size. Complete parts a} through f). 75.748 126.552 139.151 75.364 68.803 222.051 69.068 55.930 73.880 97,778 76,931 1 00,488 96,506 208,292 88,837 99,535 1 19,1 98 98,572 a) Make a suitable display of the sales. Choose the correct boxplot below. A. B. C. D. r. 250 r. 250 r. 250 r. 25 33 '33 if 4'3 o g 20 g g zoo g g zo g 200 I: I: E C a 150 a 150 g 150 g 15 E E a? 3 3100 3:100 3:100 \

Step by Step Solution

There are 3 Steps involved in it

Step: 1

blur-text-image

Get Instant Access to Expert-Tailored Solutions

See step-by-step solutions with expert insights and AI powered tools for academic success

Step: 2

blur-text-image

Step: 3

blur-text-image

Ace Your Homework with AI

Get the answers you need in no time with our AI-driven, step-by-step assistance

Get Started

Recommended Textbook for

Contemporary Business Mathematics With Canadian Applications

Authors: Ali R. Hassanlou, S. A. Hummelbrunner, Kelly Halliday

12th Edition

0135285011, 978-0135285015

More Books

Students also viewed these Mathematics questions