65 b. 21 ap C. 72 d. 98 b. 2.107 Suppose a data set consisting of exam scores has a lower quartile OL = 60,
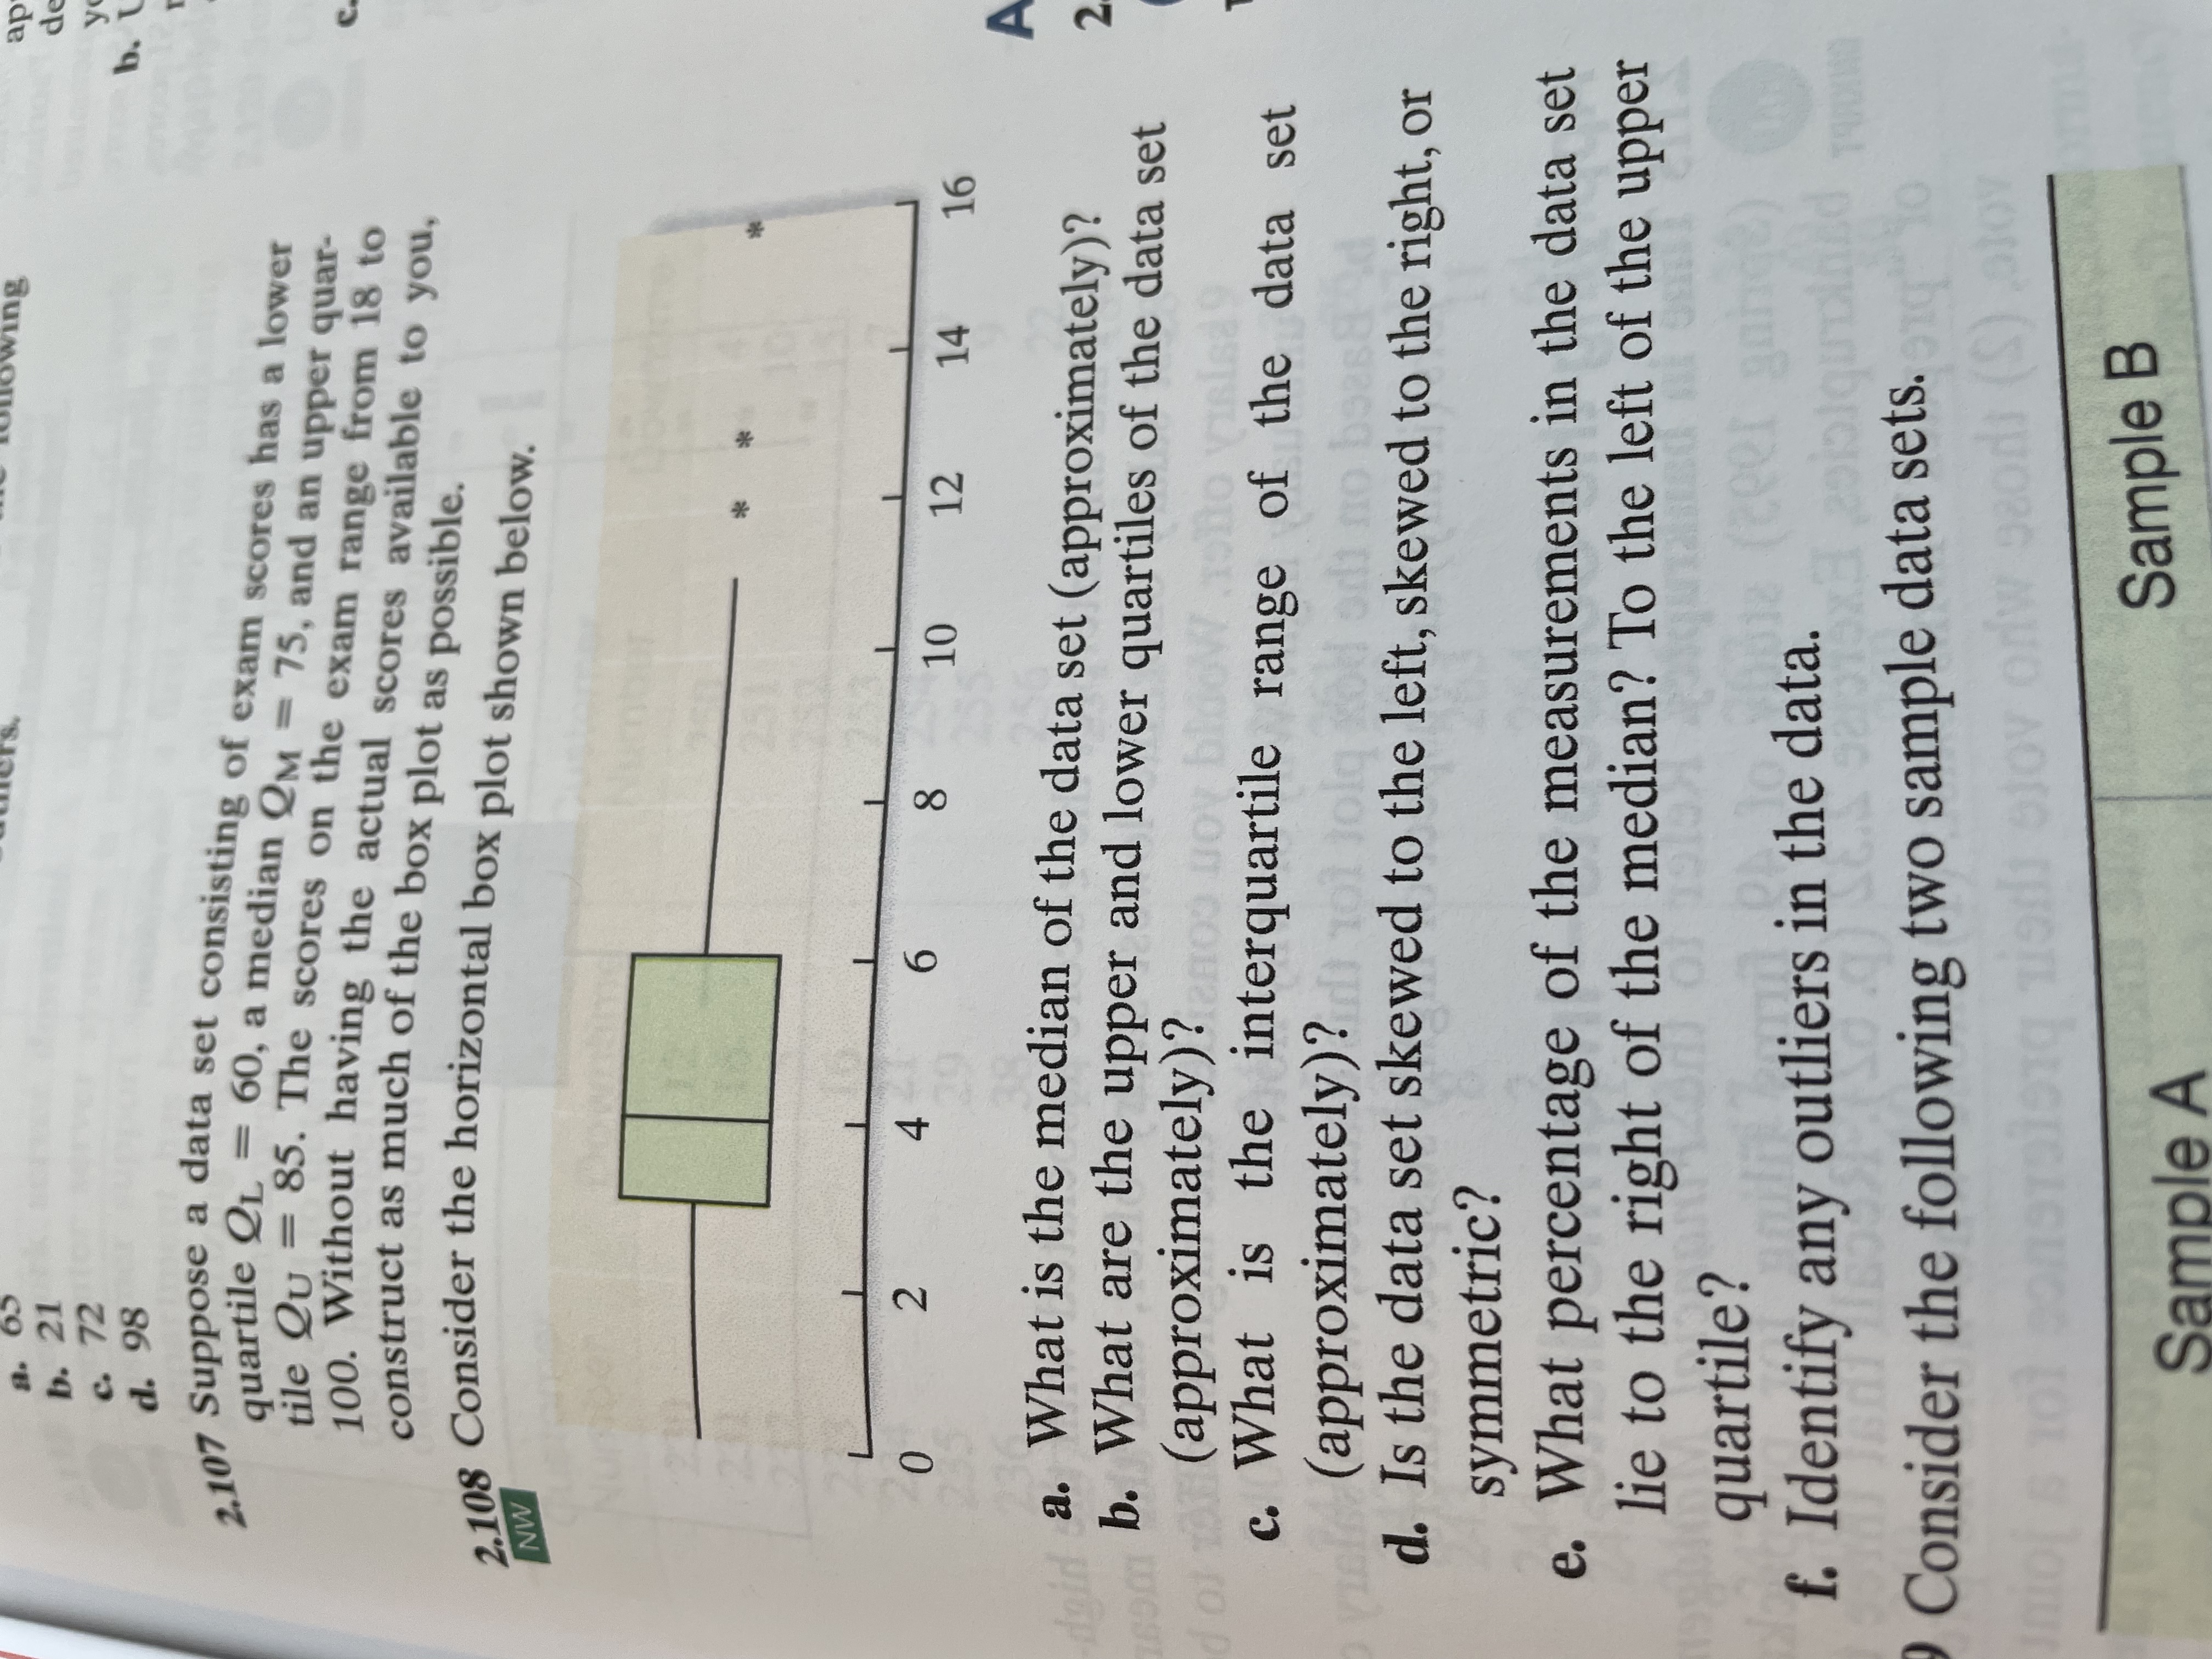
65 b. 21 ap C. 72 d. 98 b. 2.107 Suppose a data set consisting of exam scores has a lower quartile OL = 60, a median QM = 75, and an upper quar- tile Qu = 85. The scores on the exam range from 18 to 100. Without having the actual scores available to you, construct as much of the box plot as possible. NW 2.108 Consider the horizontal box plot shown below. 2 4 6 8 10 12 14 16 A a. What is the median of the data set (approximately)? b. What are the upper and lower quartiles of the data set (approximately)? c. What is the interquartile range of the data set (approximately)? ) 101 lolq d. Is the data set skewed to the left, skewed to the right, or symmetric? e. What percentage of the measurements in the data set lie to the right of the median? To the left of the upper quartile? f. Identify any outliers in the data. (peer gange) Consider the following two sample data sets. moles 101 coherelong nerds slov offw beads (S) atoy Sample A Sample B
Step by Step Solution
There are 3 Steps involved in it
Step: 1
Get Instant Access to Expert-Tailored Solutions
See step-by-step solutions with expert insights and AI powered tools for academic success
Step: 2
Step: 3
Ace Your Homework with AI
Get the answers you need in no time with our AI-driven, step-by-step assistance