

Answered step by step
Verified Expert Solution
Question
1 Approved Answer
68 130 99 116 155 69 *** The table below shows the number of one company's stores located in each of 50 regions. Complete
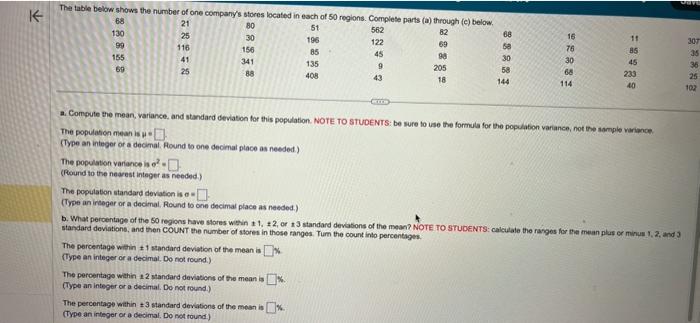
68 130 99 116 155 69 *** The table below shows the number of one company's stores located in each of 50 regions. Complete parts (a) through (c) below. 21 80 51 562 82 25 30 196 122 69 156 85 45 98 41 341 135 9 205 25 88 408 43 18 144 88233 68 16 11 307 58 85 35 30 30 45 36 58 68 233 25 114 40 102 (Type an integer or a decimal. Round to one decimal place as needed.) a. Compute the mean, variance, and standard deviation for this population. NOTE TO STUDENTS: be sure to use the formula for the population variance, not the sample variance. The population mean is p The population variance is 2- (Round to the nearest integer as needed.) The population standard deviation is e (Type an integer or a decimal. Round to one decimal place as needed.) b. What percentage of the 50 regions have stores within a 1, #2, or 3 standard deviations of the mean? NOTE TO STUDENTS: calculate the ranges for the mean plus or minus 1, 2, and 3 standard deviations, and then COUNT the number of stores in those ranges. Tum the count into percentages. The percentage within 1 standard deviation of the mean is (Type an integer or a decimal. Do not round.) The percentage within a 2 standard deviations of the mean is % (Type an integer or a decimal. Do not round.) The percentage within 3 standard deviations of the mean is % (Type an integer or a decimal. Do not round.) Jave
Step by Step Solution
There are 3 Steps involved in it
Step: 1

Get Instant Access to Expert-Tailored Solutions
See step-by-step solutions with expert insights and AI powered tools for academic success
Step: 2

Step: 3
Ace Your Homework with AI
Get the answers you need in no time with our AI-driven, step-by-step assistance
Get Started
Introduction to Accounting An Integrated Approach
Authors: Penne Ainsworth, Dan Deines
6th edition
78136601, 978-0078136603