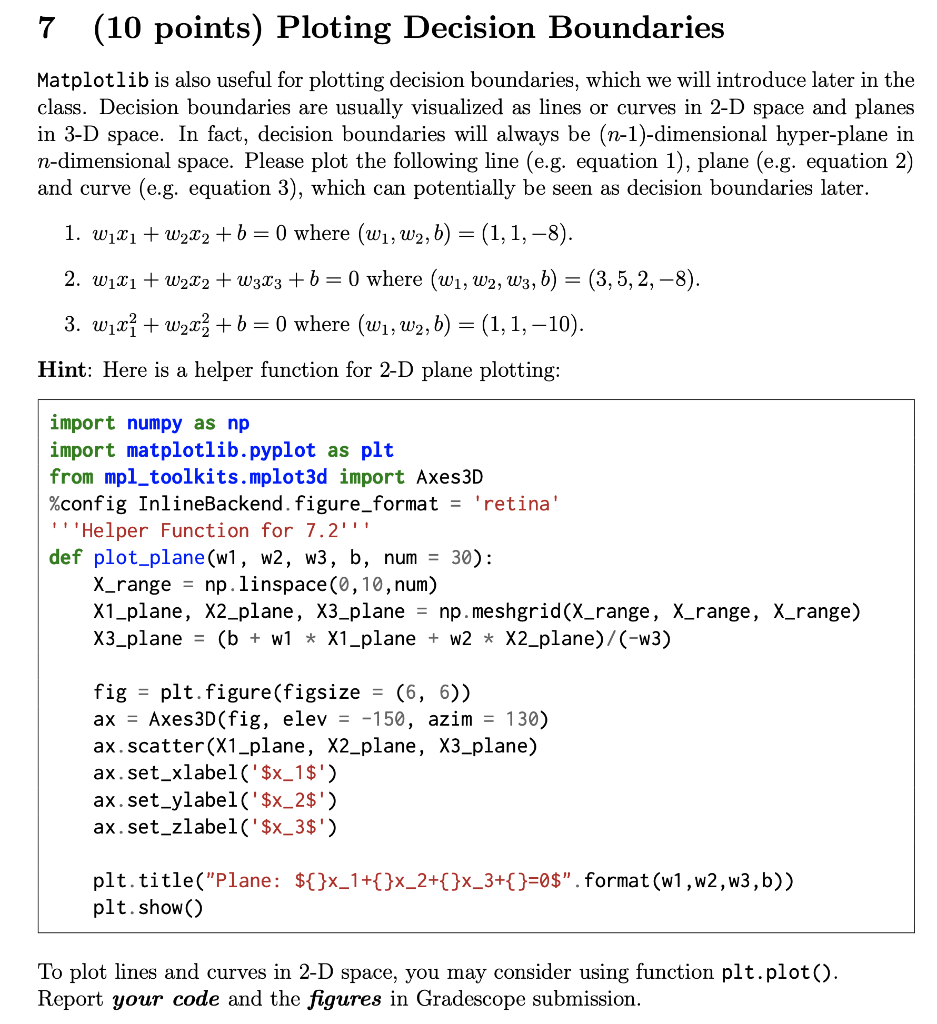
7 (10 points) Ploting Decision Boundaries Matplotlib is also useful for plotting decision boundaries, which we will introduce later in the class. Decision boundaries are usually visualized as lines or curves in 2-D space and planes in 3-D space. In fact, decision boundaries will always be (n-1)-dimensional hyper-plane in n-dimensional space. Please plot the following line (e.g. equation 1), plane (e.g. equation 2) and curve (e.g. equation 3), which can potentially be seen as decision boundaries later. 1. W1x1 + W212 +b=0 where (W1, W2, b) = (1,1,8). 2. W1X1 + W222 + W323 +b=0 where (W1, W2, W3, b) = (3, 5, 2, -8). 3. Wix} + w2x2 + b = 0 where (W1, W2,b) = (1,1,-10). Hint: Here is a helper function for 2-D plane plotting: import numpy as np import matplotlib.pyplot as plt from mpl_toolkits.mplot3d import Axes 3D %config InlineBackend. figure_format = 'retina' "' 'Helper Function for 7.2''! def plot_plane(w1, W2, W3, b, num = 30): X_range = np.linspace(0,10, num) X1_plane, X2_plane, X3_plane = np.meshgrid(X_range, X_range, X_range) X3_plane = (b + w1 * X1_plane + W2 * X2_plane)/(-w3) fig = plt. figure(figsize = (6, 6)) ax = Axes 3D(fig, elev = -150, azim = 130) ax. scatter (X1_plane, X2_plane, X3_plane) ax.set_xlabel('$x_1$') ax.set_ylabel('$x_2$') ax.set_zlabel('$x_3$') plt.title("Plane: ${}x_1+{}x_2+{ }x_3+{ }=0$".format(w1,w2,w3, b)) plt.show() To plot lines and curves in 2-D space, you may consider using function plt.plot(). Report your code and the figures in Gradescope submission. 7 (10 points) Ploting Decision Boundaries Matplotlib is also useful for plotting decision boundaries, which we will introduce later in the class. Decision boundaries are usually visualized as lines or curves in 2-D space and planes in 3-D space. In fact, decision boundaries will always be (n-1)-dimensional hyper-plane in n-dimensional space. Please plot the following line (e.g. equation 1), plane (e.g. equation 2) and curve (e.g. equation 3), which can potentially be seen as decision boundaries later. 1. W1x1 + W212 +b=0 where (W1, W2, b) = (1,1,8). 2. W1X1 + W222 + W323 +b=0 where (W1, W2, W3, b) = (3, 5, 2, -8). 3. Wix} + w2x2 + b = 0 where (W1, W2,b) = (1,1,-10). Hint: Here is a helper function for 2-D plane plotting: import numpy as np import matplotlib.pyplot as plt from mpl_toolkits.mplot3d import Axes 3D %config InlineBackend. figure_format = 'retina' "' 'Helper Function for 7.2''! def plot_plane(w1, W2, W3, b, num = 30): X_range = np.linspace(0,10, num) X1_plane, X2_plane, X3_plane = np.meshgrid(X_range, X_range, X_range) X3_plane = (b + w1 * X1_plane + W2 * X2_plane)/(-w3) fig = plt. figure(figsize = (6, 6)) ax = Axes 3D(fig, elev = -150, azim = 130) ax. scatter (X1_plane, X2_plane, X3_plane) ax.set_xlabel('$x_1$') ax.set_ylabel('$x_2$') ax.set_zlabel('$x_3$') plt.title("Plane: ${}x_1+{}x_2+{ }x_3+{ }=0$".format(w1,w2,w3, b)) plt.show() To plot lines and curves in 2-D space, you may consider using function plt.plot(). Report your code and the figures in Gradescope submission