

Answered step by step
Verified Expert Solution
Question
1 Approved Answer
#7: 2 (Ratio analysis) The financial statements and industry norms for Pamplin Inc. are shown in the popup window: 0 a. Compute the ratios in
#7: 2 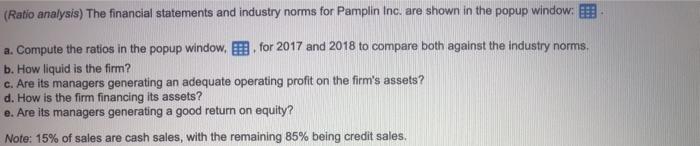
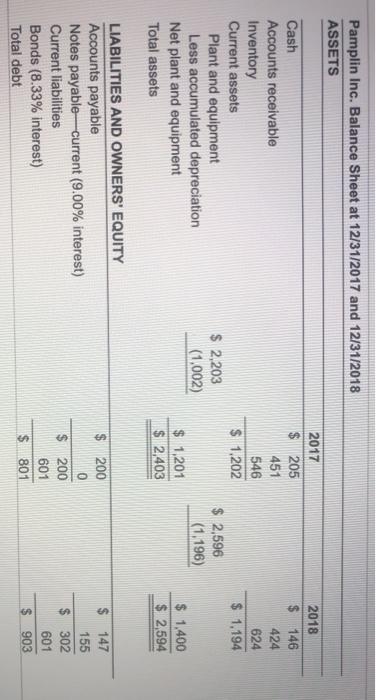
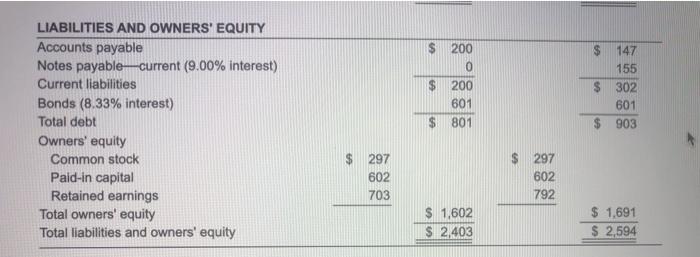
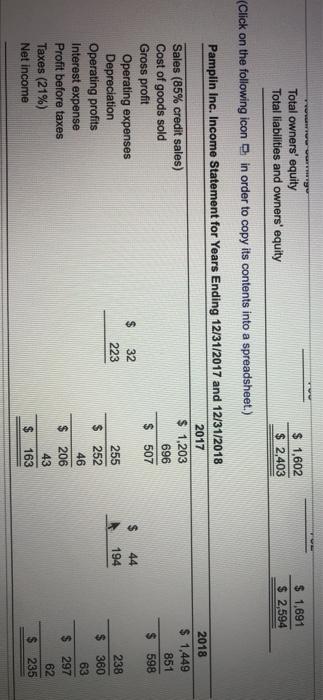
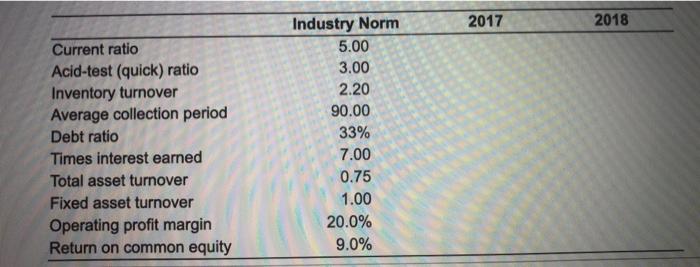
(Ratio analysis) The financial statements and industry norms for Pamplin Inc. are shown in the popup window: 0 a. Compute the ratios in the popup window. E. for 2017 and 2018 to compare both against the industry norms. b. How liquid is the firm? c. Are its managers generating an adequate operating profit on the firm's assets? d. How is the firm financing its assets? e. Are its managers generating a good return on equity? Note: 15% of sales are cash sales, with the remaining 85% being credit sales, Pamplin Inc. Balance Sheet at 12/31/2017 and 12/31/2018 ASSETS 2017 $ 205 451 546 $ 1.202 2018 $ 146 424 624 $ 1,194 Cash Accounts receivable Inventory Current assets Plant and equipment Less accumulated depreciation Net plant and equipment Total assets $ 2,203 (1.002) $ 2,596 (1.196) $ 1,201 $ 2,403 1,400 $ 2,594 LIABILITIES AND OWNERS' EQUITY Accounts payable Notes payable current (9.00% interest) Current liabilities Bonds (8.33% interest) Total debt $ 200 0 $ 200 601 $ 801 $ 147 155 $ 302 601 $ 903 LIABILITIES AND OWNERS' EQUITY Accounts payable Notes payable current (9.00% interest) Current liabilities Bonds (8.33% interest) Total debt Owners' equity Common stock Pald-in capital Retained earnings Total owners' equity Total liabilities and owners' equity $ 200 0 $ 200 601 $ 801 $ 147 155 $ 302 601 $ 903 $ 297 602 703 $ 297 602 792 $ 1,602 S 2.403 1,691 $ 2,594 VWww Total owners' equity Total liabilities and owners' equity $ 1,602 $ 2,403 $ 1,691 $ 2,594 (Click on the following icon in order to copy its contents into a spreadsheet.) 2018 $ 1,449 851 $ 598 $ $ Pamplin Inc. Income Statement for Years Ending 12/31/2017 and 12/31/2018 2017 Sales (85% credit sales) $ 1,203 Cost of goods sold 696 Gross profit $ 507 Operating expenses 32 Depreciation 223 255 Operating profits $ 252 Interest expense 46 Profit before taxes $ 206 Taxes (21%) 43 Net Income $ 163 44 194 238 360 63 $ 297 62 $ 235 2017 2018 Current ratio Acid-test (quick) ratio Inventory turnover Average collection period Debt ratio Times interest earned Total asset turnover Fixed asset turnover Operating profit margin Return on common equity Industry Norm 5.00 3.00 2.20 90.00 33% 7.00 0.75 1.00 20.0% 9.0% Step by Step Solution
There are 3 Steps involved in it
Step: 1

Get Instant Access to Expert-Tailored Solutions
See step-by-step solutions with expert insights and AI powered tools for academic success
Step: 2

Step: 3
Ace Your Homework with AI
Get the answers you need in no time with our AI-driven, step-by-step assistance
Get Started
Clinical Audit In Oral Pathology Laboratory A Wide Range Of Quality Improvement
Authors: Rudra Bhardwaj, Narendra Nath Singh, Sherin Nair
1st Edition
3330343052, 978-3330343054