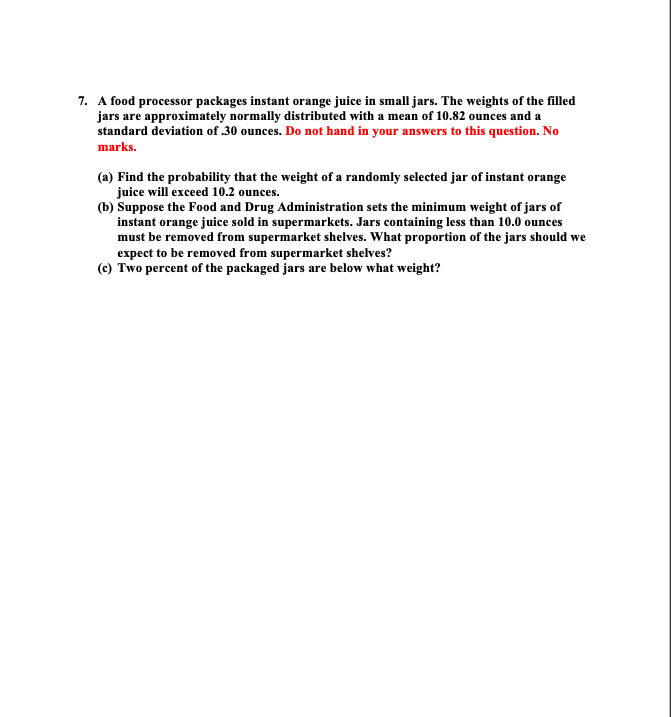
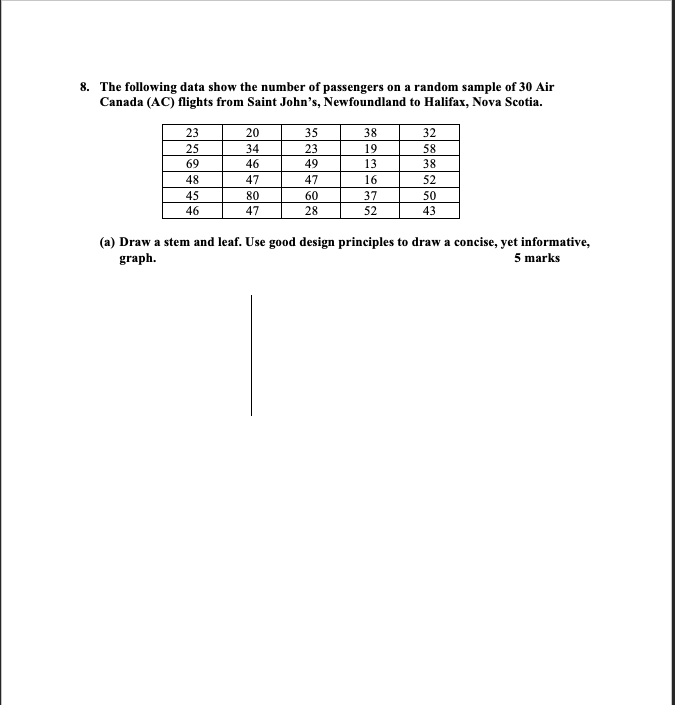
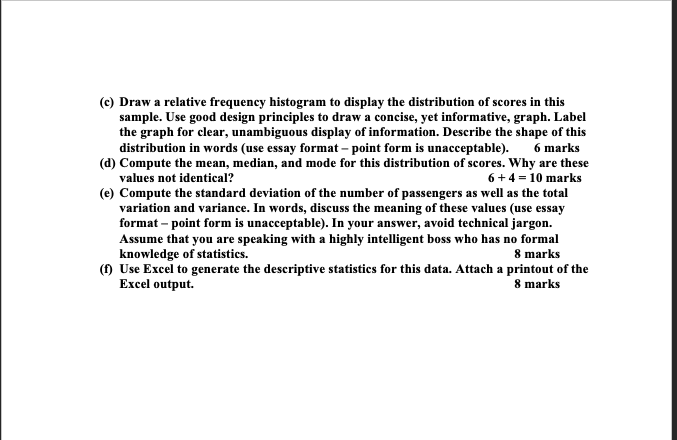
7. A food processor packages instant orange juice in small jars. The weights of the filled jars are approximately normally distributed with a mean of 10.82 ounces and a standard deviation of .30 ounces. Do not hand in your answers to this question. No marks. (a) Find the probability that the weight of a randomly selected jar of instant orange juice will exceed 10.2 ounces. (b) Suppose the Food and Drug Administration sets the minimum weight of jars of instant orange juice sold in supermarkets. Jars containing less than 10.0 ounces must be removed from supermarket shelves. What proportion of the jars should we expect to be removed from supermarket shelves? (c) Two percent of the packaged jars are below what weight?8. The following data show the number of passengers on a random sample of 30 Air Canada (AC) flights from Saint John's, Newfoundland to Halifax, Nova Scotia. 23 20 35 38 32 25 34 23 19 58 69 46 49 13 38 48 47 47 16 52 45 80 60 46 47 37 50 28 52 43 (a) Draw a stem and leaf. Use good design principles to draw a concise, yet informative, graph. 5 marks(b) Construct a frequency distribution table to display the distribution of scores in this sample. Use good design principles to draw a concise, yet informative, graph. 6 marks (Marks will be taken off for using poor table design guidelines.)(c) Draw a relative frequency histogram to display the distribution of scores in this sample. Use good design principles to draw a concise, yet informative, graph. Label the graph for clear, unambiguous display of information. Describe the shape of this distribution in words (use essay format - point form is unacceptable). 6 marks (d) Compute the mean, median, and mode for this distribution of scores. Why are these values not identical? 6 +4 =10 marks (e) Compute the standard deviation of the number of passengers as well as the total variation and variance. In words, discuss the meaning of these values (use essay format - point form is unacceptable). In your answer, avoid technical jargon. Assume that you are speaking with a highly intelligent boss who has no formal knowledge of statistics. 8 marks (f) Use Excel to generate the descriptive statistics for this data. Attach a printout of the Excel output. 8 marks


