Answered step by step
Verified Expert Solution
Question
1 Approved Answer
7. A group of randomly chosen high school students were asked to jog on the spot for varying amounts of time (in minutes), after which
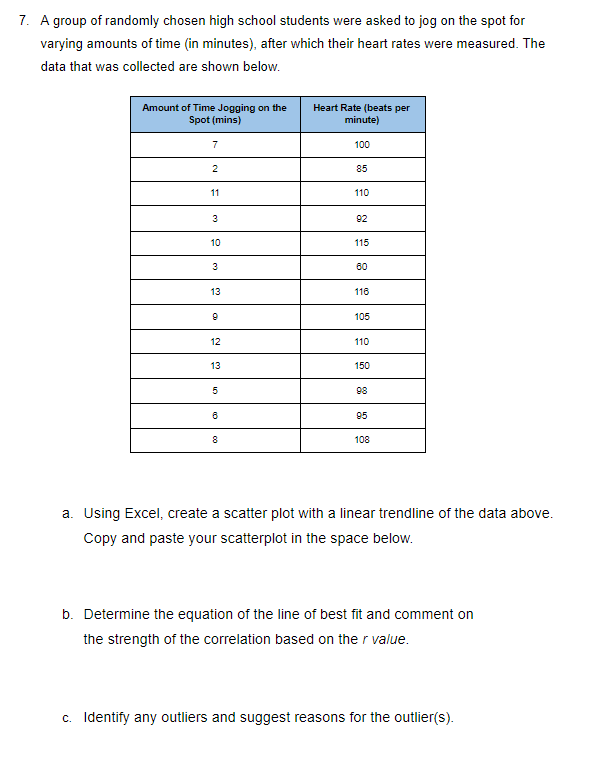
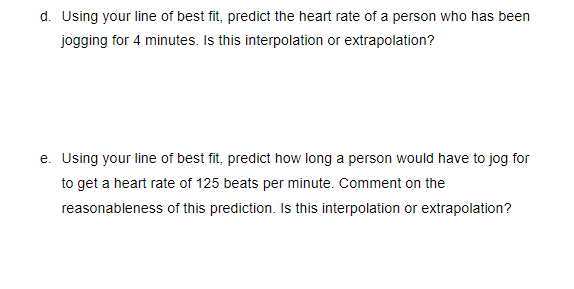
7. A group of randomly chosen high school students were asked to jog on the spot for varying amounts of time (in minutes), after which their heart rates were measured. The data that was collected are shown below. Amount of Time Jogging on the Heart Rate (beats per Spot (mins) minute 7 100 2 85 11 110 3 92 10 115 80 13 116 105 12 110 13 150 108 a. Using Excel, create a scatter plot with a linear trendline of the data above. Copy and paste your scatterplot in the space below. b. Determine the equation of the line of best fit and comment on the strength of the correlation based on the r value. c. Identify any outliers and suggest reasons for the outlier(s).d. Using your line of best it predict the heart rate of a person who has been jogging for 4 minutes. Is this interpolation or extrapolation? e. Using your line of best t, predict hoar long a person would have to jog for to get a heart rate of 125 beats per minute. Comment on the reasonableness of this prediction. Is this interpolation or extrapolation
Step by Step Solution
There are 3 Steps involved in it
Step: 1
Get Instant Access to Expert-Tailored Solutions
See step-by-step solutions with expert insights and AI powered tools for academic success
Step: 2
Step: 3
Ace Your Homework with AI
Get the answers you need in no time with our AI-driven, step-by-step assistance
Get Started