Answered step by step
Verified Expert Solution
Link Copied!

Question

1 Approved Answer

7. Below is the actual data for the spread of the Zika virus during weeks 6-10 of the epidemic. Week # New Cases Cumulative Cases
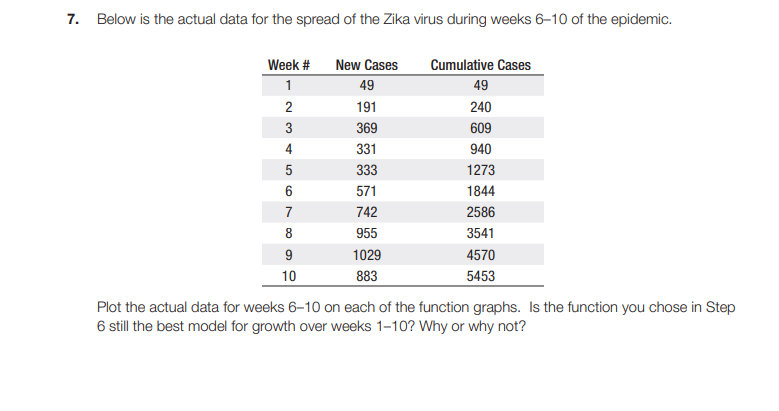
image text in transcribed
7. Below is the actual data for the spread of the Zika virus during weeks 6-10 of the epidemic. Week # New Cases Cumulative Cases 49 49 2 191 240 3 369 609 331 940 333 1273 571 1844 742 2586 955 3541 9 1029 4570 10 883 5453 Plot the actual data for weeks 6-10 on each of the function graphs. Is the function you chose in Step 6 still the best model for growth over weeks 1-10? Why or why not

Step by Step Solution

There are 3 Steps involved in it

Step: 1

blur-text-image

Get Instant Access to Expert-Tailored Solutions

See step-by-step solutions with expert insights and AI powered tools for academic success

Step: 2

blur-text-image_2

Step: 3

blur-text-image_3

Ace Your Homework with AI

Get the answers you need in no time with our AI-driven, step-by-step assistance

Get Started

Recommended Textbook for

Statistical Techniques in Business and Economics

Authors: Douglas A. Lind, William G Marchal

17th edition

1259666360, 978-1259666360

More Books

Students also viewed these Mathematics questions

Question

1. How does value analysis differ from value engineering?

Answered: 1 week ago