Answered step by step
Verified Expert Solution
Question
1 Approved Answer
7. Effect size - Cohen's d and r squared An industrial/organizational psychologist has been consulting with a company that runs weekend job-seeking workshops for


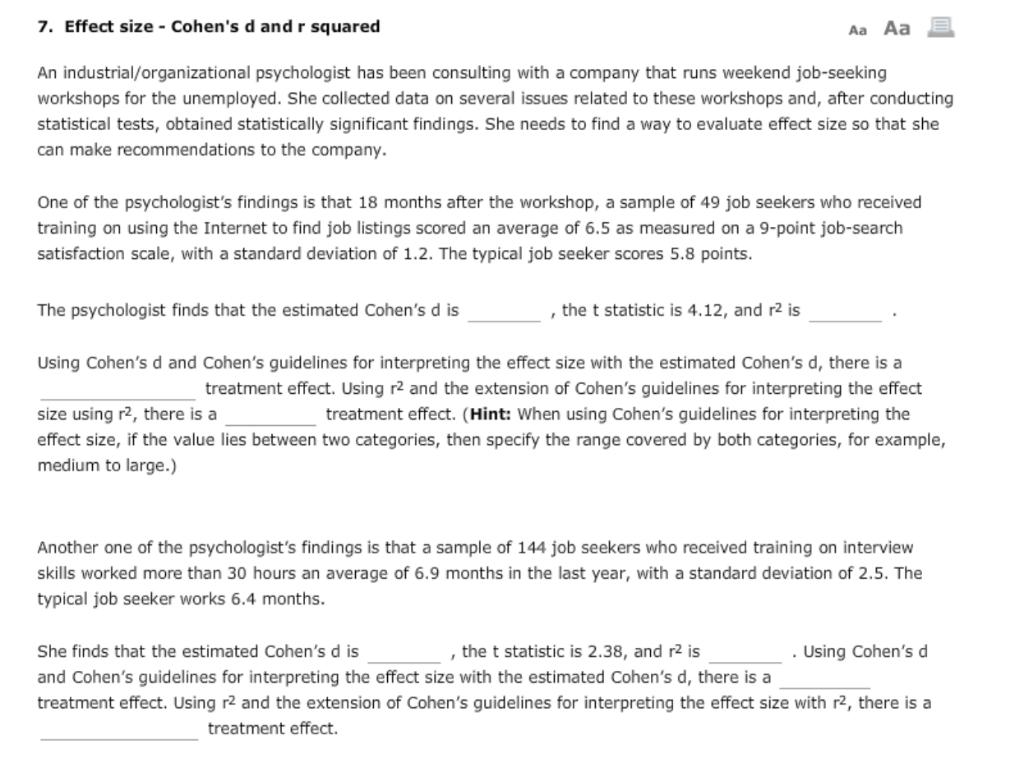
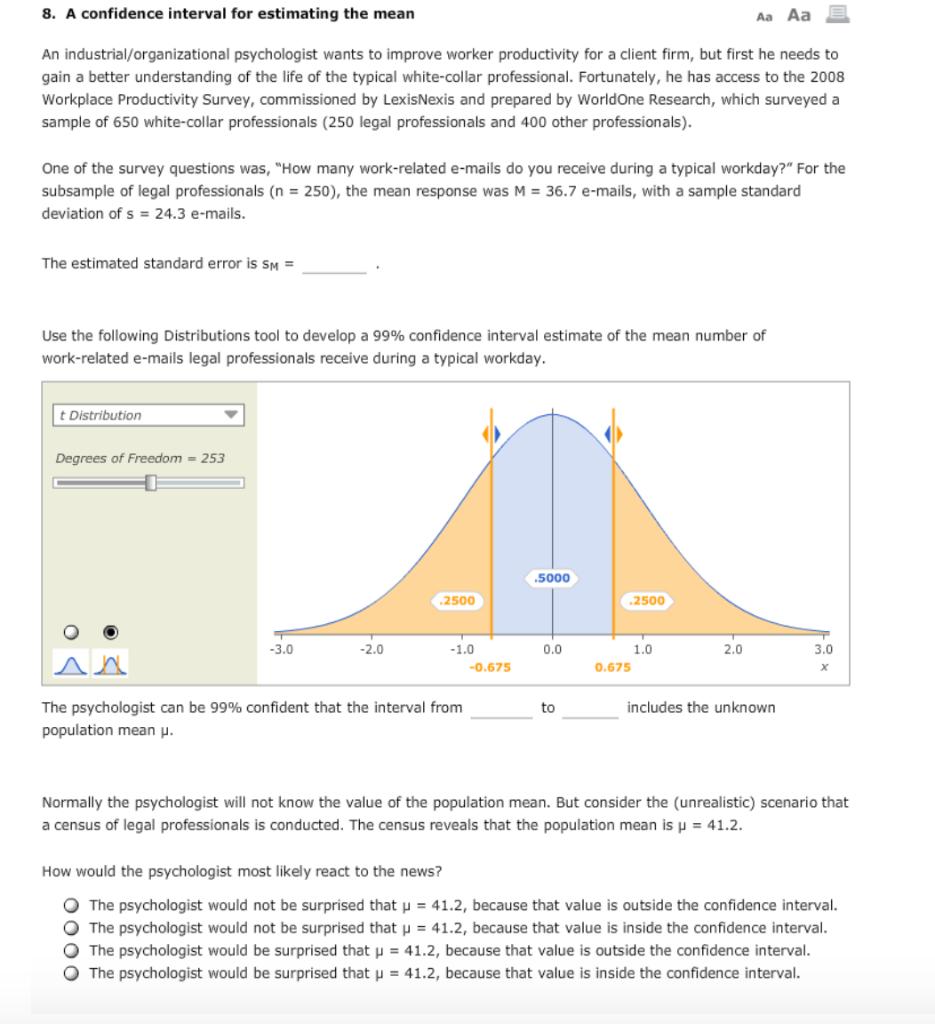
7. Effect size - Cohen's d and r squared An industrial/organizational psychologist has been consulting with a company that runs weekend job-seeking workshops for the unemployed. She collected data on several issues related to these workshops and, after conducting statistical tests, obtained statistically significant findings. She needs to find a way to evaluate effect size so that she can make recommendations to the company. One of the psychologist's findings is that 18 months after the workshop, a sample of 49 job seekers who received training on using the Internet to find job listings scored an average of 6.5 as measured on a 9-point job-search satisfaction scale, with a standard deviation of 1.2. The typical job seeker scores 5.8 points. The psychologist finds that the estimated Cohen's d is Aa Aa the t statistic is 4.12, and r is Using Cohen's d and Cohen's guidelines for interpreting the effect size with the estimated Cohen's d, there is a treatment effect. Using r and the extension of Cohen's guidelines for interpreting the effect size using r, there is a treatment effect. (Hint: When using Cohen's guidelines for interpreting the effect size, if the value lies between two categories, then specify the range covered by both categories, for example, medium to large.) Another one of the psychologist's findings is that a sample of 144 job seekers who received training on interview skills worked more than 30 hours an average of 6.9 months in the last year, with a standard deviation of 2.5. The typical job seeker works 6.4 months. She finds that the estimated Cohen's d is , the t statistic is 2.38, and r2 is . Using Cohen's d and Cohen's guidelines for interpreting the effect size with the estimated Cohen's d, there is a treatment effect. Using r2 and the extension of Cohen's guidelines for interpreting the effect size with r2, there is a treatment effect. 8. A confidence interval for estimating the mean An industrial/organizational psychologist wants to improve worker productivity for a client firm, but first he needs to gain a better understanding of the life of the typical white-collar professional. Fortunately, he has access to the 2008 Workplace Productivity Survey, commissioned by LexisNexis and prepared by WorldOne Research, which surveyed a sample of 650 white-collar professionals (250 legal professionals and 400 other professionals). One of the survey questions was, "How many work-related e-mails do you receive during a typical workday?" For the subsample of legal professionals (n = 250), the mean response was M = 36.7 e-mails, with a sample standard deviation of s= 24.3 e-mails. The estimated standard error is SM = Use the following Distributions tool to develop a 99% confidence interval estimate of the mean number of work-related e-mails legal professionals receive during a typical workday. t Distribution Degrees of Freedom = 253 -3.0 -2.0 2500 -1.0 The psychologist can be 99% confident that the interval from population mean . -0.675 .5000 0.0 to 0.675 2500 Aa Aa 1.0 2.0 includes the unknown 3.0 X Normally the psychologist will not know the value of the population mean. But consider the (unrealistic) scenario that a census of legal professionals is conducted. The census reveals that the population mean is = 41.2. How would the psychologist most likely react to the news? O The psychologist would not be surprised that u = 41.2, because that value is outside the confidence interval. The psychologist would not be surprised that u = 41.2, because that value is inside the confidence interval. The psychologist would be surprised that u = 41.2, because that value is outside the confidence interval. O The psychologist would be surprised that = 41.2, because that value is inside the confidence interval.
Step by Step Solution
★★★★★
3.45 Rating (148 Votes )
There are 3 Steps involved in it
Step: 1
ANSWER ATTACHED IMAGE Answers From given data Sample Size ...
Get Instant Access to Expert-Tailored Solutions
See step-by-step solutions with expert insights and AI powered tools for academic success
Step: 2

Step: 3

Ace Your Homework with AI
Get the answers you need in no time with our AI-driven, step-by-step assistance
Get Started


