Answered step by step
Verified Expert Solution
Link Copied!

Question

1 Approved Answer

7. The following chart describes a stock's 6-month trading history. From mid-April to mid-July, the trading pattern is reasonably uneventful. Using at least 4 signals
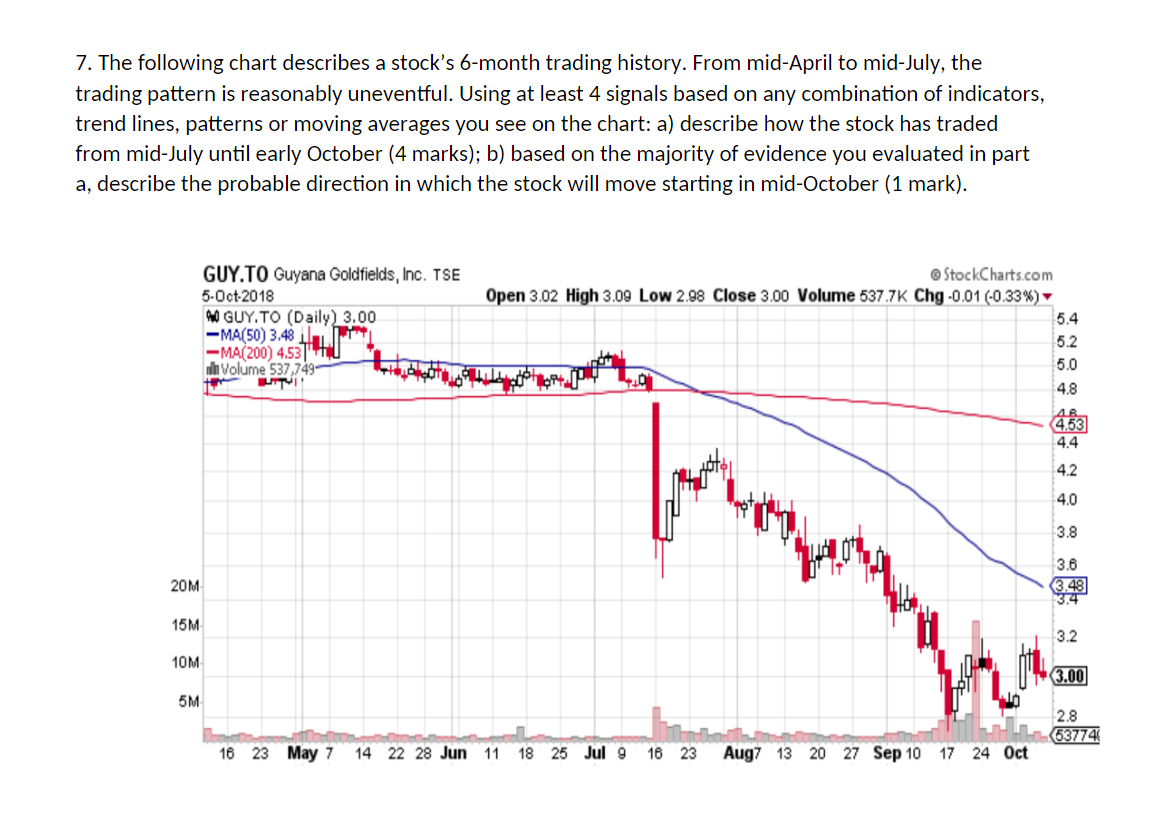
image text in transcribed

7. The following chart describes a stock's 6-month trading history. From mid-April to mid-July, the trading pattern is reasonably uneventful. Using at least 4 signals based on any combination of indicators, trend lines, patterns or moving averages you see on the chart: a) describe how the stock has traded from mid-July until early October (4 marks); b) based on the majority of evidence you evaluated in part a, describe the probable direction in which the stock will move starting in mid-October (1 mark). GUY.TO Guyana Goldfields, Inc. TSE 5-Oct-2018 W GUY.TO (Daily) 3.00 -MA(50) 3.48 4 -MA(200) 4.531 ilh Volume 537,749 LIMIT StockCharts.com Open 3.02 High 3.09 Low 2.98 Close 3.00 Volume 537.7K Chg-0.01 (-0.33%) 5.4 5.2 5.0 420 4.8 AB 4.53 4.4 4.2 4.0 3.8 20M 3.6 3.48 3.4 15M 3.2 10M 3.00 5M 2.8 53774 16 23 May 7 14 22 28 Jun 11 18 25 Jul 9 16 23 Aug7 13 20 27 Sep 10 17 24 Oct

Step by Step Solution

There are 3 Steps involved in it

Step: 1

blur-text-image

Get Instant Access to Expert-Tailored Solutions

See step-by-step solutions with expert insights and AI powered tools for academic success

Step: 2

blur-text-image_2

Step: 3

blur-text-image_3

Ace Your Homework with AI

Get the answers you need in no time with our AI-driven, step-by-step assistance

Get Started

Recommended Textbook for

The Brutal Reality Of Day Trading For Beginners The Harsh Truth About Day Trading

Authors: J.r. Calcaterra

1st Edition

1541374746, 978-1541374744

More Books

Students also viewed these Finance questions

Question

1.who the father of Ayurveda? 2. Who the father of taxonomy?

Answered: 1 week ago

Question

Commen Name with scientific name Tiger - Wolf- Lion- Cat- Dog-

Answered: 1 week ago