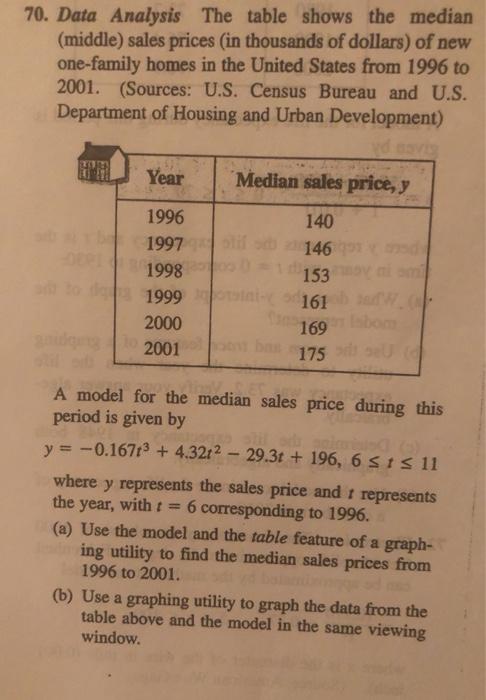
70. Data Analysis The table shows the median (middle) sales prices (in thousands of dollars) of...
Fantastic news! We've Found the answer you've been seeking!
Question:
Transcribed Image Text:
70. Data Analysis The table shows the median (middle) sales prices (in thousands of dollars) of new one-family homes in the United States from 1996 to 2001. (Sources: U.S. Census Bureau and U.S. Department of Housing and Urban Development) vd savig Year Median sales price, y 1996 140 1997 otif 146 1998 D 153 atto di 1999-161 2000 sbom 169 2001 175 A model for the median sales price during this period is given by stil od anim y= -0.1673 + 4.3212 - 29.31+ 196, 6 1 11 () where y represents the sales price and 1 represents the year, with = 6 corresponding to 1996. (a) Use the model and the table feature of a graph- ing utility to find the median sales prices from 1996 to 2001. (b) Use a graphing utility to graph the data from the table above and the model in the same viewing window. (c) Use the model to estimate the median sales prices in 2005 and 2010. Do the values seem reasonable? Explain. (d) Use the zoom and trace features of a graphing utility to determine during which year(s) the median sales price exceeded $160,000. 70. Data Analysis The table shows the median (middle) sales prices (in thousands of dollars) of new one-family homes in the United States from 1996 to 2001. (Sources: U.S. Census Bureau and U.S. Department of Housing and Urban Development) vd savig Year Median sales price, y 1996 140 1997 otif 146 1998 D 153 atto di 1999-161 2000 sbom 169 2001 175 A model for the median sales price during this period is given by stil od anim y= -0.1673 + 4.3212 - 29.31+ 196, 6 1 11 () where y represents the sales price and 1 represents the year, with = 6 corresponding to 1996. (a) Use the model and the table feature of a graph- ing utility to find the median sales prices from 1996 to 2001. (b) Use a graphing utility to graph the data from the table above and the model in the same viewing window. (c) Use the model to estimate the median sales prices in 2005 and 2010. Do the values seem reasonable? Explain. (d) Use the zoom and trace features of a graphing utility to determine during which year(s) the median sales price exceeded $160,000.
Expert Answer:
Related Book For
Posted Date:
Students also viewed these finance questions
-
Consider the network diagram and the corresponding table showing L2 and L3 addresses for the various clients. At each step from source to destination the IP packet is sent as the payload of an L2...
-
The table shows the life expectancies of a child (at birth) in the United States for selected years from 1940 through 2010. (Source: U.S. National Center for Health Statistics) A model for the life...
-
Question: Old MathJax webview Old MathJax webview i need ans of these question but the source is alot Old MathJax webviewOld MathJax webview i need ans of these question but the source is alot these...
-
A slipper-pad bearing (Fig. P1023) is often encountered in lubrication problems. Oil flows between two blocks; the upper one is stationary, and the lower one is moving in this case. The drawing is...
-
Excel can find eigenvalues and eigenvectors of real, symmetric matrices as follows. If the eigenvalues of the nth-order real, symmetric matrix H are arranged in increasing order: (1 ( (2 ( ( ( ( (...
-
With respect to the capital asset pricing model, the market risk premium is: A. Less than the excess market return. B. Equal to the excess market return. C. Greater than the excess market return.
-
Discuss the financing involved in purchasing a home.
-
Gershwin Corporation obtained a franchise from Sonic Hedgehog Inc. for a cash payment of $120,000 on April 1, 2012. The franchise grants Gershwin the right to sell certain products and services for a...
-
Must use Excel Data Case (Modified - Instructions) This is your second interview with a prestigious brokerage firm for a job as an equity analyst. You survived the morning interviews with the...
-
After its first month of operations, Paquette Advisors showed the following account balances in its General Ledger accounts as at January 31, 2014. During February, the following transactions...
-
Current Attempt in Progress Edward Roddick is the new owner of Ace Computer Services. At the end of August 2023, his first month of ownership, Roddick is trying to prepare monthly financial...
-
Why do supply-siders emphasize the importance of marginal tax rates in relation to incentives?
-
What are the two main types of supply-side policy and what is the difference between them?
-
What is the relevance of the size of the output gap in policymaking?
-
What are the main features of the so-called fiscal compact?
-
What are the two ways in which the output gap can be calculated and what is the difference between them?
-
Provide and explain two (2) strategies used to build agency-client relationships below. Activity Strategy 1: Strategy 2: Your answer 1. Discuss three techniques used to identify the needs and...
-
Prove the result that the R 2 associated with a restricted least squares estimator is never larger than that associated with the unrestricted least squares estimator. Conclude that imposing...
-
-b - c2 Evaluate the expression for a = 2, b = -5, c = -4, and d = 10.
-
Integers between -6 and 3, inclusive Graph the numbers on a number line.
-
In 2013, the mean annual per-person consumption of cheese was 33.7 pounds, up 13.1% from 2000. What was the mean annual per- person consumption of cheese in 2000?
-
What are the differences between a firms physical assets and its intellectual assets?
-
In the Kessler International survey, what percentage of employees steal from their employers? a. 42% b. 51% c. 56% d. 79% e. None of the above
-
Consult your university course catalog(s) and put together a list of courses outside the ac- counting curriculum that you believe would help create a well-rounded forensic education.
Study smarter with the SolutionInn App