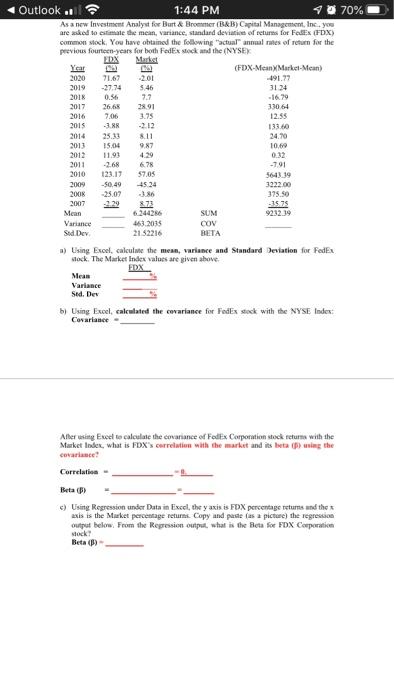
70% Outlook. 1:44 PM As a new Investment Analyst for Burt & Brommer (B&B) Capital Management, Inc. you are asked to estimate the mean variance, standard deviation of returns for FedEx FDX) common stock. You have obtained the following actual annual rates of return for the previous fourteen years for both FedEx stock and the (NYSEX DX Marks Year (FDX-Mean Market Mean) 2020 71.67 201 491.77 2019 -27.74 546 3124 2013 0.56 7.7 -1679 2017 26.65 28.91 33064 2016 7.06 12.55 2015 -3. -2.12 133.00 25.33 811 24.70 2013 15.04 987 10.10 2012 11.91 4.29 0.32 2011 -268 678 -791 2010 123.17 57.05 5643.39 2009 -50.49 4524 3222.00 2006 25.07 3.86 375.50 2007 -1575 Mean 624426 SUM 9232.39 Variance 463.2015 COV Sid Dev 2152216 BETA a) Using Excel, calculate the meas, variance and Standard Deviation for FedEx Hock. The Market Index values are given above FDX Variance Sed. Der Using Excel, calculated the covariance for FedEx sock with the NYSE Index: Covariance - After sing Excel to calculate the covariance of Fodex Corporation stock returns with the Market Index, what is FDX's correlation with the market and its beta (sing the covariance! Correlation - Beta (B) c) Using Regression under Data in Excel, they axis.is FDX percentage returns and the axis is the Market percentage return Copy and paste lasa picture) the regression output below From the Regression output, what is the Beta for FDX Corporation stock Beta (3) 70% Outlook. 1:44 PM As a new Investment Analyst for Burt & Brommer (B&B) Capital Management, Inc. you are asked to estimate the mean variance, standard deviation of returns for FedEx FDX) common stock. You have obtained the following actual annual rates of return for the previous fourteen years for both FedEx stock and the (NYSEX DX Marks Year (FDX-Mean Market Mean) 2020 71.67 201 491.77 2019 -27.74 546 3124 2013 0.56 7.7 -1679 2017 26.65 28.91 33064 2016 7.06 12.55 2015 -3. -2.12 133.00 25.33 811 24.70 2013 15.04 987 10.10 2012 11.91 4.29 0.32 2011 -268 678 -791 2010 123.17 57.05 5643.39 2009 -50.49 4524 3222.00 2006 25.07 3.86 375.50 2007 -1575 Mean 624426 SUM 9232.39 Variance 463.2015 COV Sid Dev 2152216 BETA a) Using Excel, calculate the meas, variance and Standard Deviation for FedEx Hock. The Market Index values are given above FDX Variance Sed. Der Using Excel, calculated the covariance for FedEx sock with the NYSE Index: Covariance - After sing Excel to calculate the covariance of Fodex Corporation stock returns with the Market Index, what is FDX's correlation with the market and its beta (sing the covariance! Correlation - Beta (B) c) Using Regression under Data in Excel, they axis.is FDX percentage returns and the axis is the Market percentage return Copy and paste lasa picture) the regression output below From the Regression output, what is the Beta for FDX Corporation stock Beta (3)