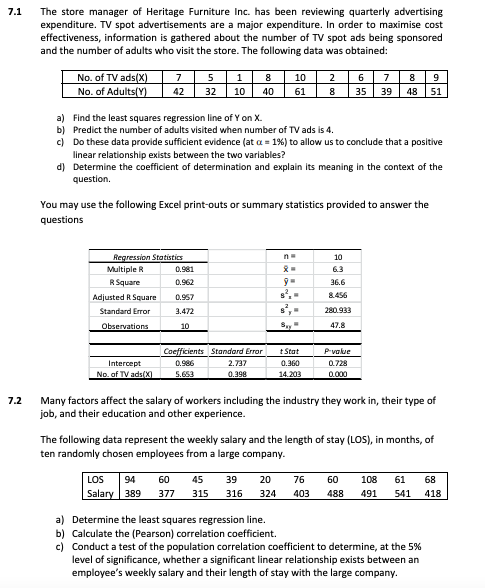
7.1 The store manager of Heritage Furniture Inc. has been reviewing quarterly advertising expenditure. TV spot advertisements are a major expenditure. In order to maximise cost effectiveness, information is gathered about the number of TV spot ads being sponsored and the number of adults who visit the store. The following data was obtained: No. of TV ads(X) 7 5 1 10 2 6 7 9 No. of Adults(Y) 42 32 10 40 61 35 39 48 51 a) Find the least squares regression line of Y on X. Predict the number of adults visited when number of TV ads is 4. c) Do these data provide sufficient evidence (at a = 1%%) to allow us to conclude that a positive linear relationship exists between the two variables? d) Determine the coefficient of determination and explain its meaning in the context of the question. You may use the following Excel print-outs or summary statistics provided to answer the questions Regression Statistics 10 Multiple R 0.981 CE R Square 0.962 Adjusted R Square 0.937 3.496 Standard Error 3.472 Observations 10 Coefficients Standard Error t Stat Intercept 0.986 2.737 0.728 No. of TVadsk) 14.203 0.000 7.2 Many factors affect the salary of workers including the industry they work in, their type of job, and their education and other experience. The following data represent the weekly salary and the length of stay (LOS), in months, of ten randomly chosen employees from a large company. LOS 94 60 45 39 20 76 60 108 61 68 Salary 189 377 315 316 324 403 488 491 541 418 a) Determine the least squares regression line. b) Calculate the (Pearson) correlation coefficient. c) Conduct a test of the population correlation coefficient to determine, at the 5% level of significance, whether a significant linear relationship exists between an employee's weekly salary and their length of stay with the large company