Answered step by step
Verified Expert Solution
Question
1 Approved Answer
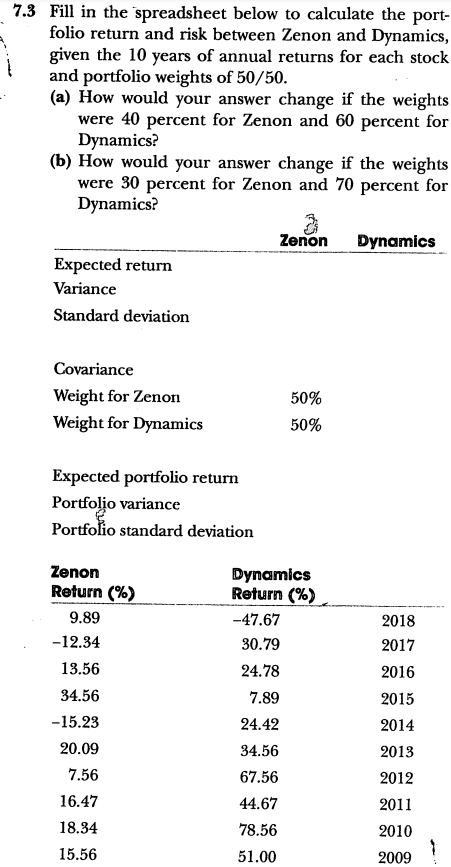
7.3 Fill in the spreadsheet below to calculate the port- folio return and risk between Zenon and Dynamics, given the 10 years of annual


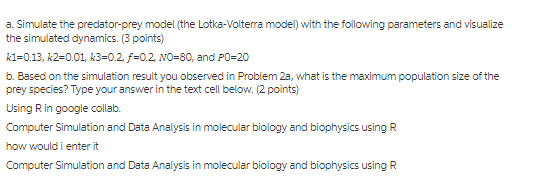
7.3 Fill in the spreadsheet below to calculate the port- folio return and risk between Zenon and Dynamics, given the 10 years of annual returns for each stock and portfolio weights of 50/50. (a) How would your answer change if the weights were 40 percent for Zenon and 60 percent for Dynamics? (b) How would your answer change if the weights were 30 percent for Zenon and 70 percent for Dynamics? Expected return Variance Standard deviation Covariance Weight for Zenon Weight for Dynamics Expected portfolio return Portfolio variance Portfolio standard deviation Zenon Return (%) 9.89 -12.34 13.56 34.56 -15.23 20.09 7.56 16.47 18.34 15.56 Zenon Dynamics 50% 50% Dynamics Return (%) -47.67 30.79 24.78 7.89 24.42 34.56 67.56 44.67 78.56 51.00 2018 2017 2016 2015 2014 2013 2012 2011 2010 2009 a. Simulate the predator-prey model (the Lotka-Volterra model) with the following parameters and visualize the simulated dynamics. (3 points) k1=0.13, k2=0.01, k3=0.2, f-0.2, NO=80, and P0=20 b. Based on the simulation result you observed in Problem 2a, what is the maximum population size of the prey species? Type your answer in the text cell below. (2 points) Using R in google collab. Computer Simulation and Data Analysis in molecular biology and biophysics using R how would i enter it Computer Simulation and Data Analysis in molecular biology and biophysics using R
Step by Step Solution
There are 3 Steps involved in it
Step: 1
To calculate the portfolio return and risk between Zenon and Dynamics given the 10 years of annual returns for each stock and portfolio weights follow these steps StepbyStep Calculations Given Data Ye...
Get Instant Access to Expert-Tailored Solutions
See step-by-step solutions with expert insights and AI powered tools for academic success
Step: 2

Step: 3

Ace Your Homework with AI
Get the answers you need in no time with our AI-driven, step-by-step assistance
Get Started


