

Question: The graph above represents various flows that can occur through a sewage treatment plant with the numbers on the arcs representing the maximum flow
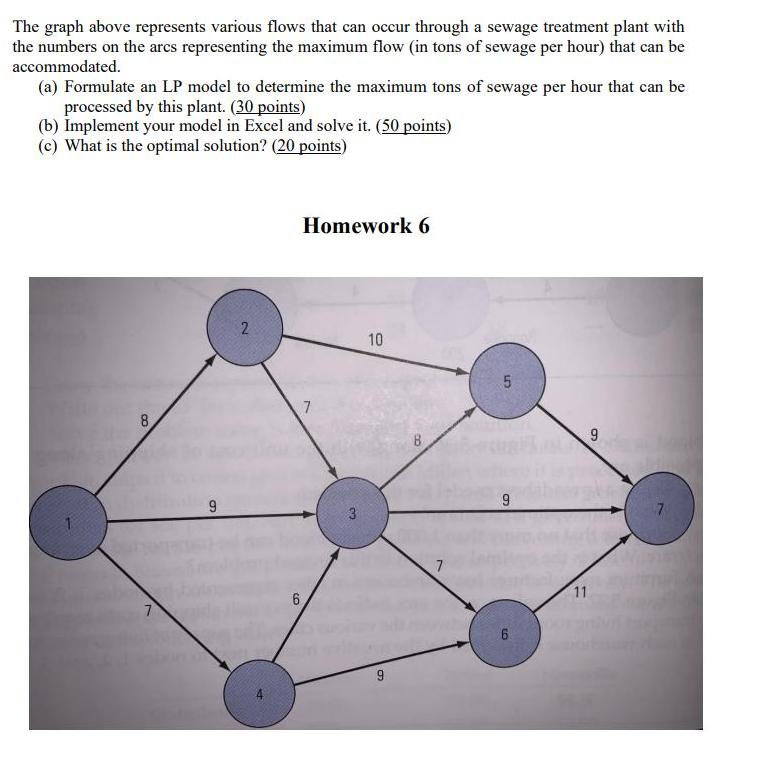
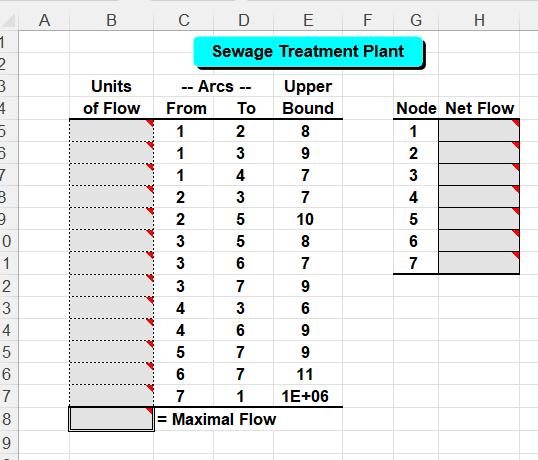
The graph above represents various flows that can occur through a sewage treatment plant with the numbers on the arcs representing the maximum flow (in tons of sewage per hour) that can be accommodated. (a) Formulate an LP model to determine the maximum tons of sewage per hour that can be processed by this plant. (30 points) (b) Implement your model in Excel and solve it. (50 points) (c) What is the optimal solution? (20 points) 8 7 9 2 6 Homework 6 7 10 9 7 5 9 6 11 9 1 2 3 1 5 5 7 3 9 0 1 2 3 4 5 6989 7 A B Units of Flow C -- Arcs -- From 1 1 1 2 2 3 3 3 4 445 4 5 6 D E F G Sewage Treatment Plant 19 7 To 2 3 7 7 1 = Maximal Flow 4 3 5 5 6 7 3 6 Upper Bound 8 9 7 7 10 8 7 9 6 9 9 11 1E+06 H Node Net Flow 1 2 3 4 5 6 7
Step by Step Solution
3.45 Rating (155 Votes )
There are 3 Steps involved in it

Get step-by-step solutions from verified subject matter experts