Answered step by step
Verified Expert Solution
Question
1 Approved Answer
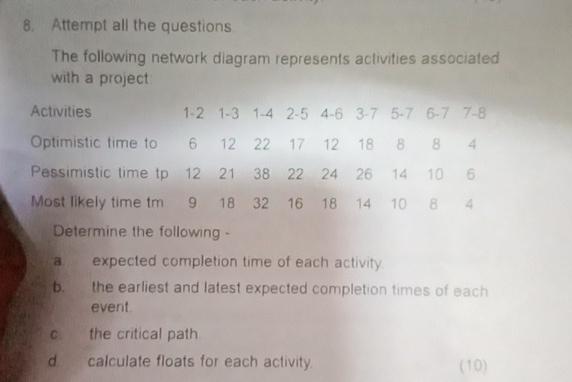
8. Attempt all the questions The following network diagram represents activities associated with a project Activities Optimistic time to Pessimistic time tp Most likely

8. Attempt all the questions The following network diagram represents activities associated with a project Activities Optimistic time to Pessimistic time tp Most likely time tm 9 18 Determine the following - a b. d 1-2 1-3 1-4 2-5 4-6 3-7 5-7 6-7 7-8 6 12 22 17 12 18 884 12 21 38 22 24 26 14 10 6 32 16 18 14 10 8 4 expected completion time of each activity the earliest and latest expected completion times of each event. the critical path calculate floats for each activity. (10)
Step by Step Solution
There are 3 Steps involved in it
Step: 1
Answer To solve this problem well use the PERT Program Evaluation and Review Technique method to cal...
Get Instant Access to Expert-Tailored Solutions
See step-by-step solutions with expert insights and AI powered tools for academic success
Step: 2

Step: 3

Ace Your Homework with AI
Get the answers you need in no time with our AI-driven, step-by-step assistance
Get Started


