Answered step by step
Verified Expert Solution
Question
1 Approved Answer
8. Compare the stock prices from the two methods to the actual stock price. What recommendations can you make as to whether clients should buy


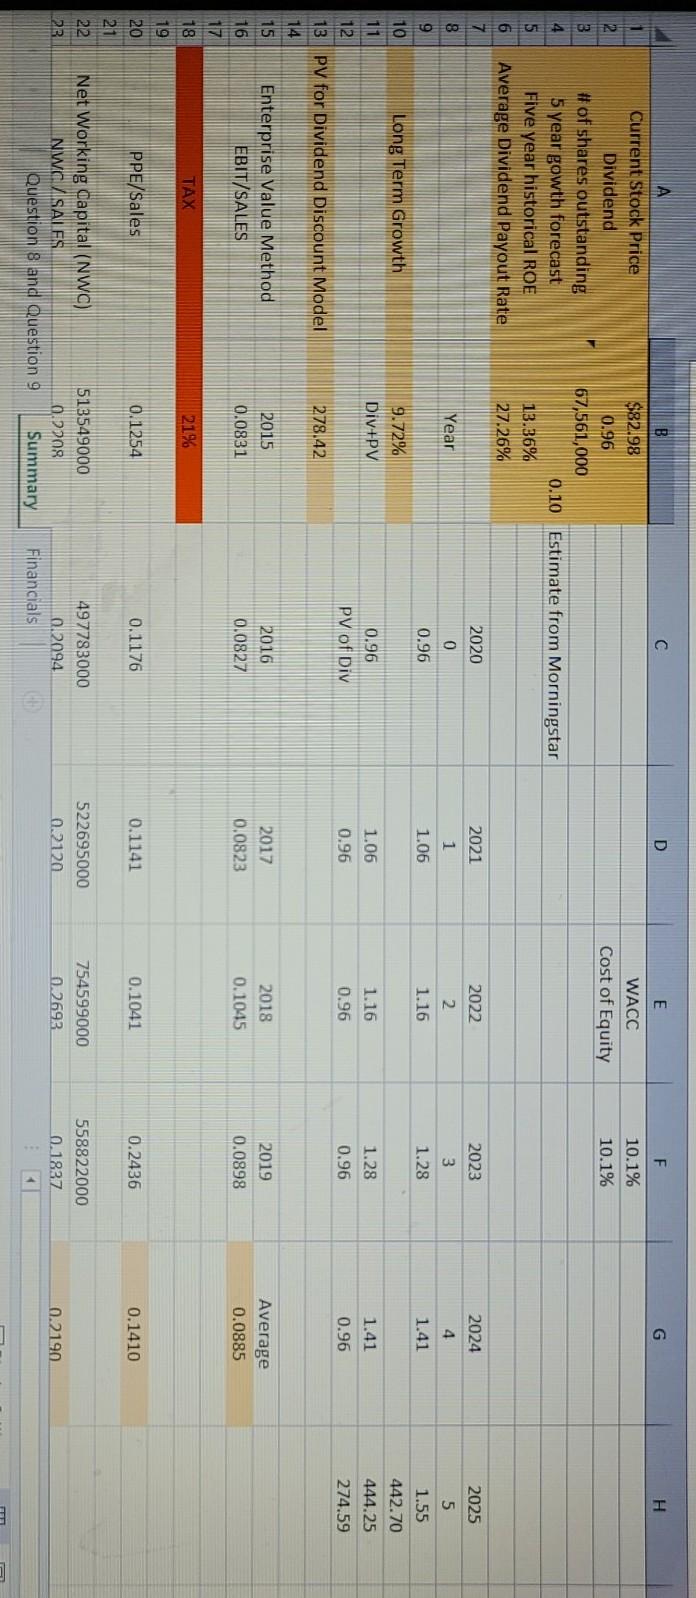
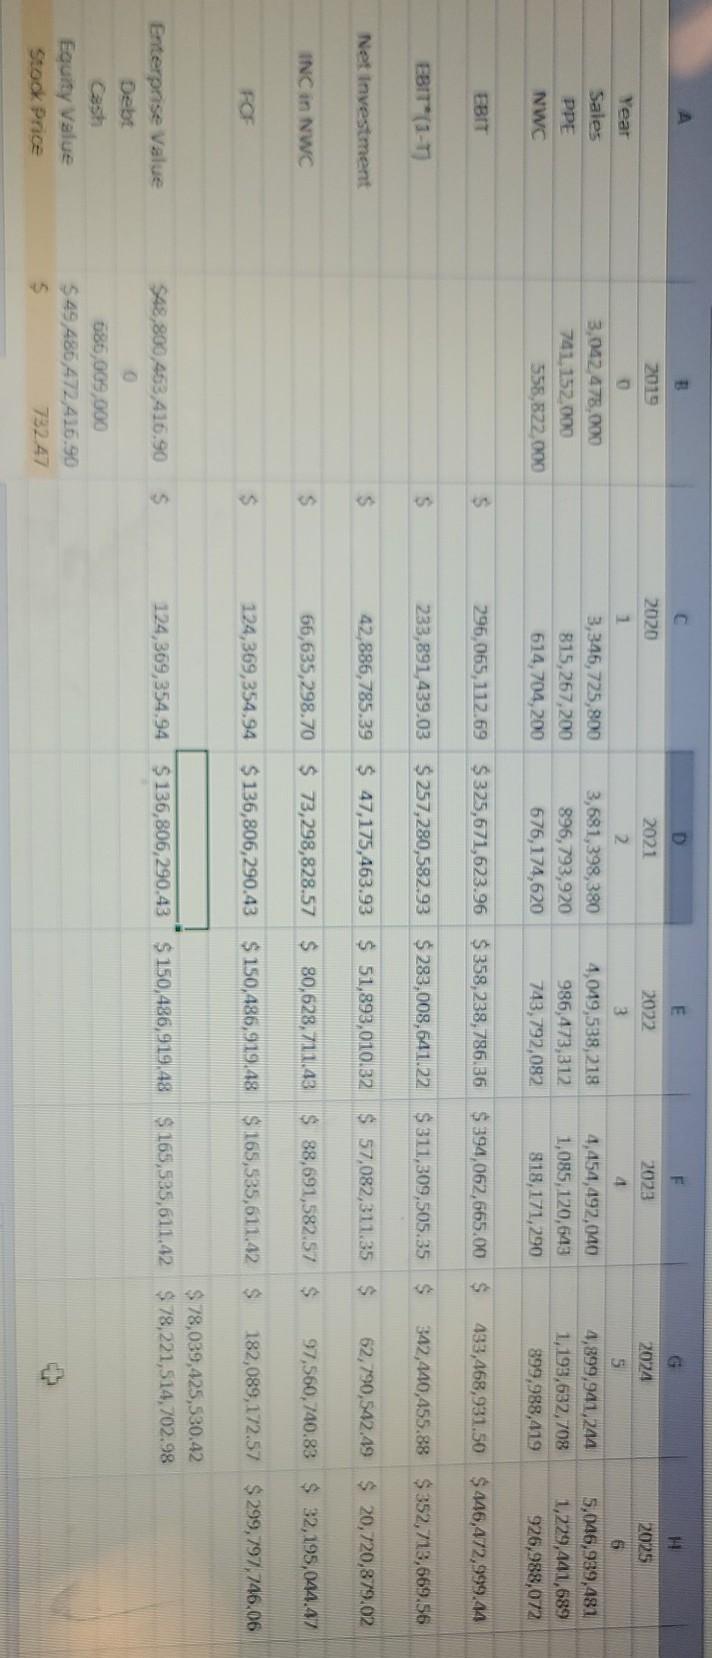
8. Compare the stock prices from the two methods to the actual stock price. What recommendations can you make as to whether clients should buy or sell Columbia stock based on your price estimates? 9. Explain to your boss why the estimates from the two valuation methods differ. Specifically, address the assumptions implicit in the models themselves as well as those you made in preparing your analysis. Why do these estimates differ from the actual stock price of Columbia? D E F G H WACC Cost of Equity 10.1% 10.1% 2022 2025 2021 1 1.06 2023 3 1.28 2024 4 2. 1.16 1.41 5 1.55 442.70 444.25 274.59 1.16 A B 1 Current Stock Price $82.98 2 Dividend 0.96 # of shares outstanding 67,561,000 4 5 year gowth forecast 0.10 Estimate from Morningstar 5 Five year historical ROE 13.36% 6 Average Dividend Payout Rate 27.26% 7 2020 8 Year 0 9 0.96 10 Long Term Growth 9.72% 11 Div+PV 0.96 12 PV of Div 13 PV for Dividend Discount Model 278.42 14 15 Enterprise Value Method 2015 2016 16 EBIT/SALES 0.0831 0.0827 17 18 TAX 21% 19 20 PPE/Sales 0.1254 0.1176 21 22 Net Working Capital (NW) 513549000 497783000 23 NWO/SALES 0.2208 0.2094 Question 8 and Question 9 Summary Financials 1.28 1.06 0.96 1.41 0.96 0.96 0.96 2017 0.0823 2018 0.1045 2019 0.0898 Average 0.0885 0.1141 0.1041 0.2436 0.1410 754599000 558822000 522695000 0.2120 0.2693 0.1837 0.2190 + D) E 2019 2022 2023 2024 2025 4 5 6 Year Sales 2020 1 3,346,725,800 815,267,200 614,704,200 3,042,478,000 741.152.000 558,522.000 2021 2 3,681,398,380 896,793,920 676,174,620 PPE NWC 4,049,538,218 986,473,312 743,792,082 4,454,492,040 1,085, 120,643 818,171,290 4,899,941,244 1,193,632,708 899,988,419 5,046,939,481 1,229,441,689 926,988,072 EBIT $ 296,065,112.69 $325,671,623.96 $ 358,238,786.36 $394,062,665.00 $ 433,468,931.50 $ 446,472,999.44 EBIT*(1-7) 5 233,891,439.03 $257,280,582.93 $283,008,641.22 $311,309,505.35 $ 342,440,455.88 $352,713,669.56 Net Investment $ 42,886,785.39 $ 47,175,463.93 $ 51,893,010.32 $ 57,082,311.35 $ 62,790,542.49 $ 20,720,879.02 INC in NWC s 66,635,298.70 $ 73,298,828.57 $ 80,628,711.43 $ 88,691,582.57 $ 97,560,740.88 $ 32,195,044.47 FO $ 124,369,354.94 $ 136,806,290.43 $ 150,486,919.48 $ 165,535,611.42 $ 182,089,172.57 $299,797,746.06 $ 78,039,425,530.42 124,369,354.94 $ 136,806,290.43 $ 150,486,919.48 S 165,525,611.42 $78,221,514,702.98 $48,800 453,416.90 S Enterprise Value Debt Cash Equity Value Stook Price 086,009,000 $ 49 486,472,416.90 73247 8. Compare the stock prices from the two methods to the actual stock price. What recommendations can you make as to whether clients should buy or sell Columbia stock based on your price estimates? 9. Explain to your boss why the estimates from the two valuation methods differ. Specifically, address the assumptions implicit in the models themselves as well as those you made in preparing your analysis. Why do these estimates differ from the actual stock price of Columbia? D E F G H WACC Cost of Equity 10.1% 10.1% 2022 2025 2021 1 1.06 2023 3 1.28 2024 4 2. 1.16 1.41 5 1.55 442.70 444.25 274.59 1.16 A B 1 Current Stock Price $82.98 2 Dividend 0.96 # of shares outstanding 67,561,000 4 5 year gowth forecast 0.10 Estimate from Morningstar 5 Five year historical ROE 13.36% 6 Average Dividend Payout Rate 27.26% 7 2020 8 Year 0 9 0.96 10 Long Term Growth 9.72% 11 Div+PV 0.96 12 PV of Div 13 PV for Dividend Discount Model 278.42 14 15 Enterprise Value Method 2015 2016 16 EBIT/SALES 0.0831 0.0827 17 18 TAX 21% 19 20 PPE/Sales 0.1254 0.1176 21 22 Net Working Capital (NW) 513549000 497783000 23 NWO/SALES 0.2208 0.2094 Question 8 and Question 9 Summary Financials 1.28 1.06 0.96 1.41 0.96 0.96 0.96 2017 0.0823 2018 0.1045 2019 0.0898 Average 0.0885 0.1141 0.1041 0.2436 0.1410 754599000 558822000 522695000 0.2120 0.2693 0.1837 0.2190 + D) E 2019 2022 2023 2024 2025 4 5 6 Year Sales 2020 1 3,346,725,800 815,267,200 614,704,200 3,042,478,000 741.152.000 558,522.000 2021 2 3,681,398,380 896,793,920 676,174,620 PPE NWC 4,049,538,218 986,473,312 743,792,082 4,454,492,040 1,085, 120,643 818,171,290 4,899,941,244 1,193,632,708 899,988,419 5,046,939,481 1,229,441,689 926,988,072 EBIT $ 296,065,112.69 $325,671,623.96 $ 358,238,786.36 $394,062,665.00 $ 433,468,931.50 $ 446,472,999.44 EBIT*(1-7) 5 233,891,439.03 $257,280,582.93 $283,008,641.22 $311,309,505.35 $ 342,440,455.88 $352,713,669.56 Net Investment $ 42,886,785.39 $ 47,175,463.93 $ 51,893,010.32 $ 57,082,311.35 $ 62,790,542.49 $ 20,720,879.02 INC in NWC s 66,635,298.70 $ 73,298,828.57 $ 80,628,711.43 $ 88,691,582.57 $ 97,560,740.88 $ 32,195,044.47 FO $ 124,369,354.94 $ 136,806,290.43 $ 150,486,919.48 $ 165,535,611.42 $ 182,089,172.57 $299,797,746.06 $ 78,039,425,530.42 124,369,354.94 $ 136,806,290.43 $ 150,486,919.48 S 165,525,611.42 $78,221,514,702.98 $48,800 453,416.90 S Enterprise Value Debt Cash Equity Value Stook Price 086,009,000 $ 49 486,472,416.90 73247
Step by Step Solution
There are 3 Steps involved in it
Step: 1

Get Instant Access to Expert-Tailored Solutions
See step-by-step solutions with expert insights and AI powered tools for academic success
Step: 2

Step: 3

Ace Your Homework with AI
Get the answers you need in no time with our AI-driven, step-by-step assistance
Get Started


