

Question
8. Economic fluctuations I The following graph shows the economy in long-run equilibrium at the expected price level of 120 and the natural level of
8. Economic fluctuations I
The following graph shows the economy in long-run equilibrium at the expected price level of 120 and the natural level of output of $600 billion. Suppose the government increases spending on building and repairing highways, bridges, and ports.
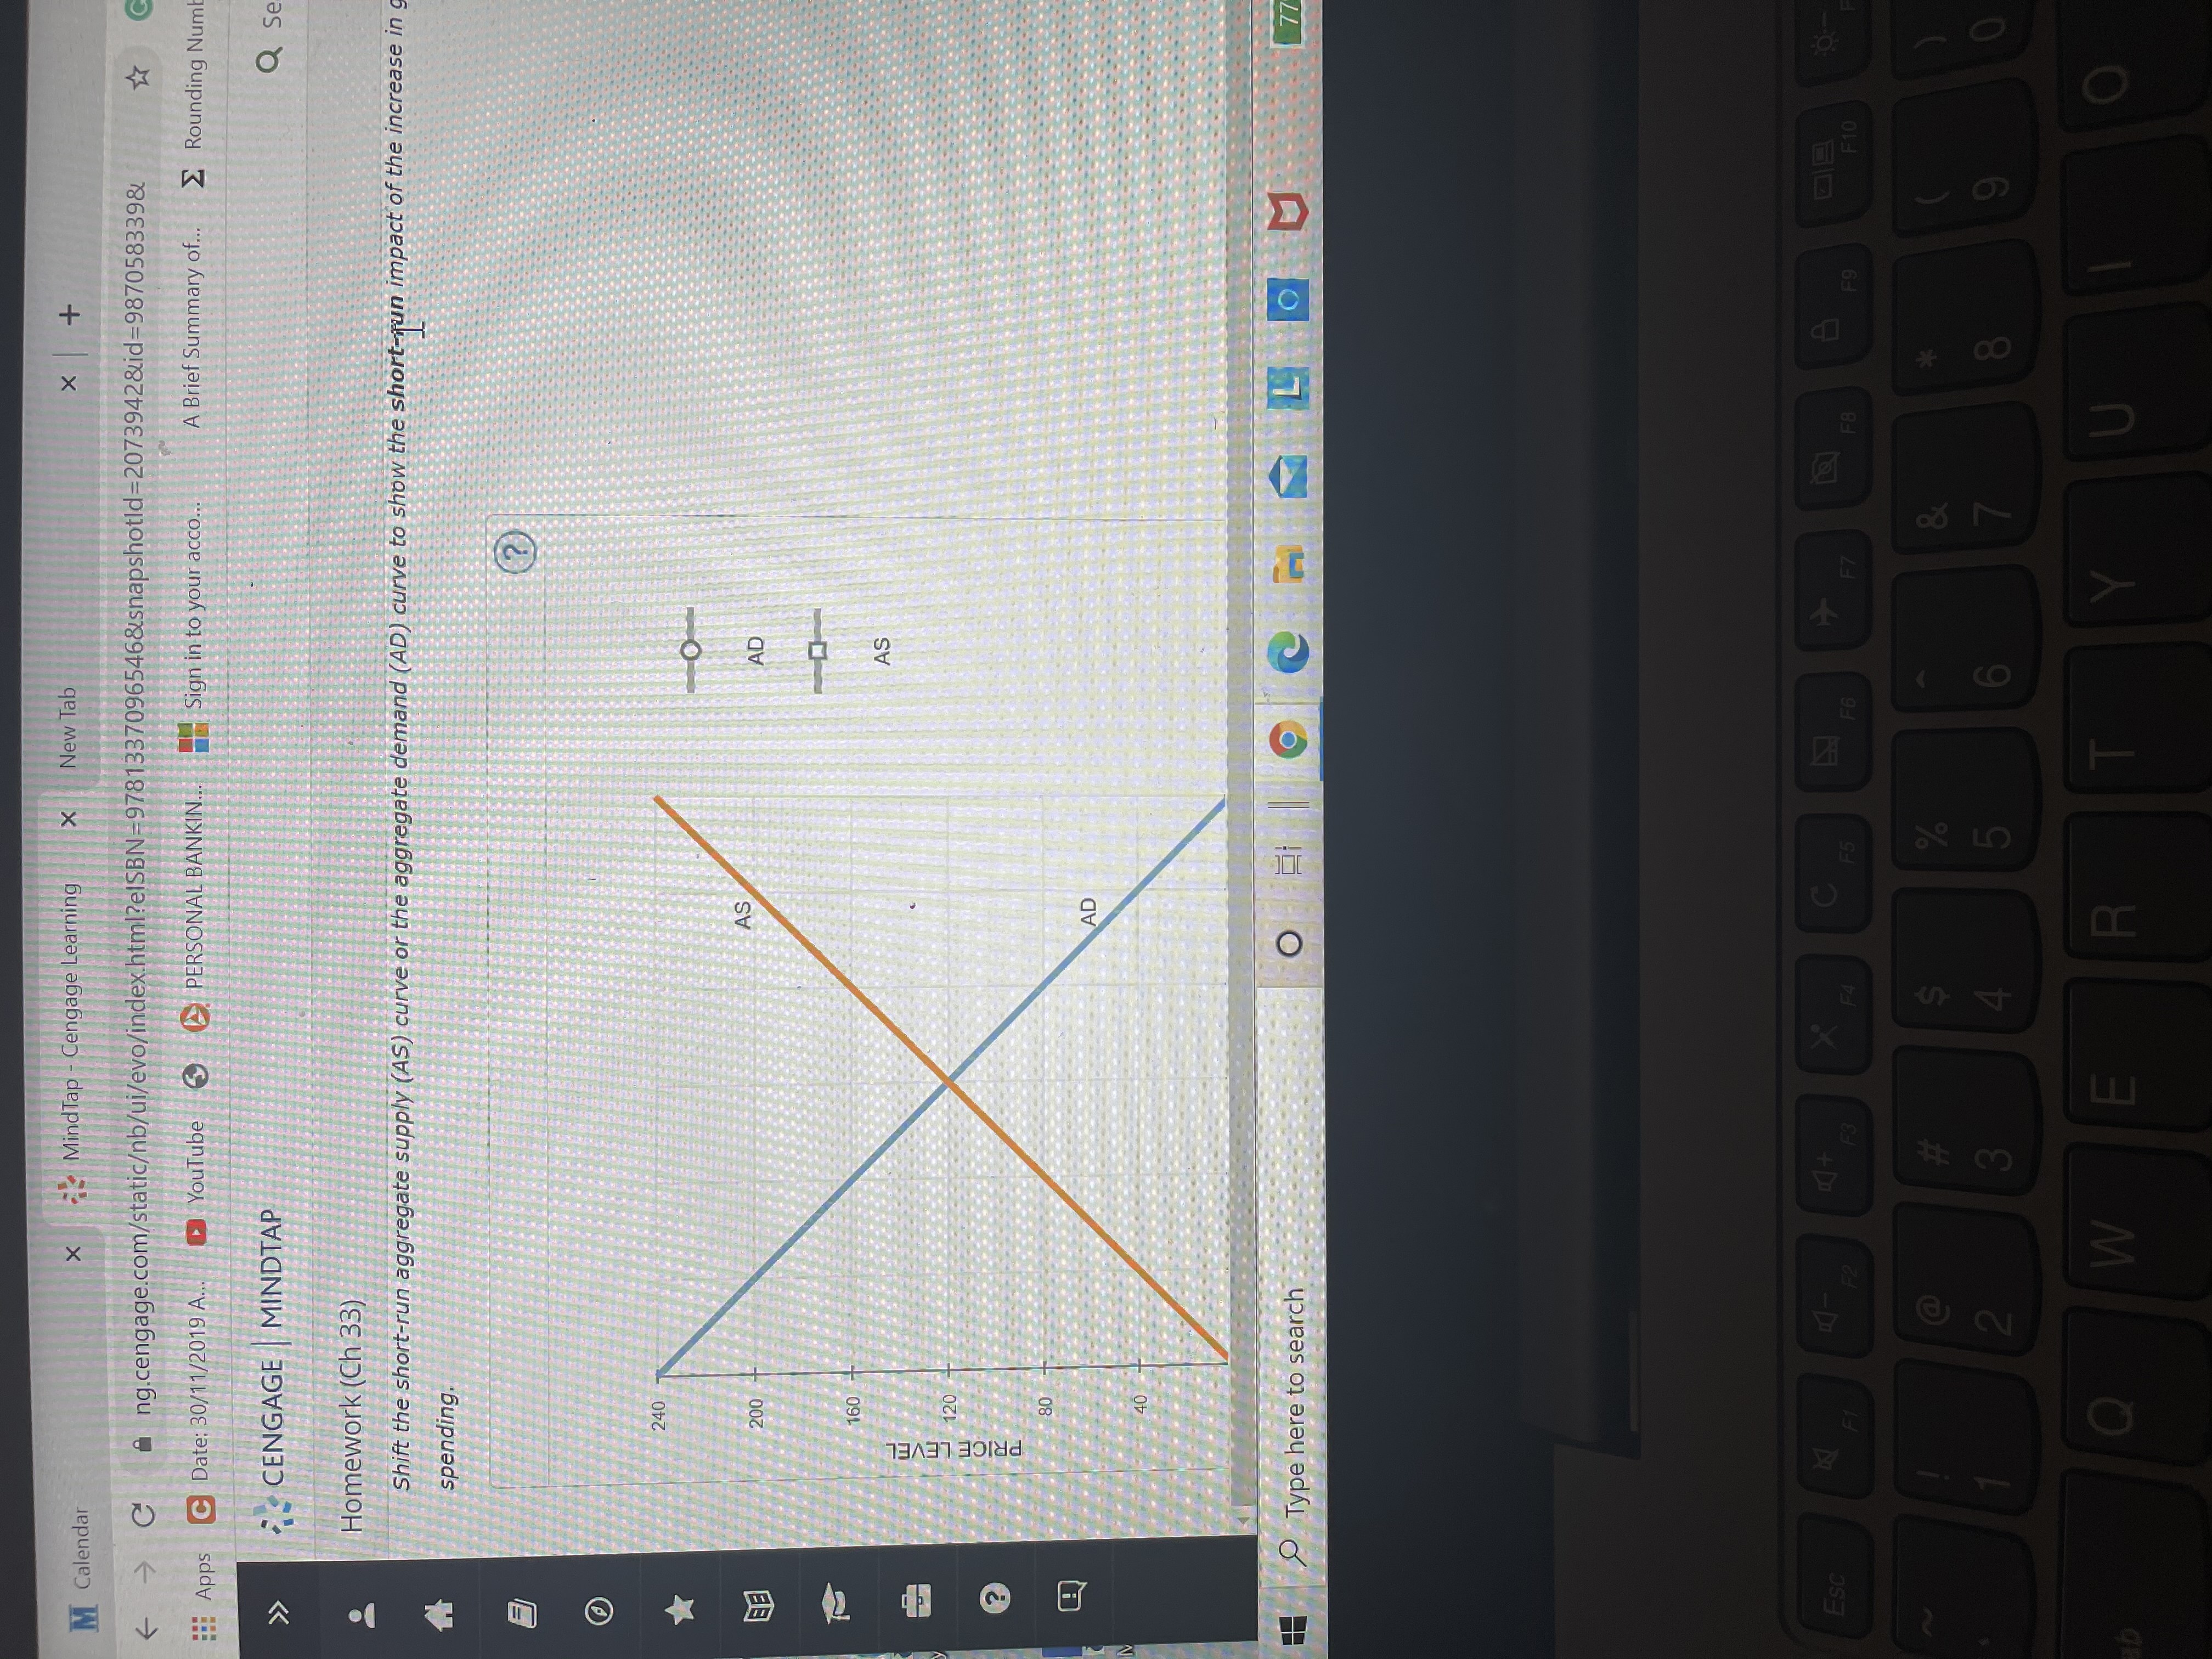
Shift the short-run aggregate supply (AS) curve or the aggregate demand (AD) curve to show theshort-runimpact of the increase in government spending.
In the short run, the increase in government spending on infrastructure causes the price level to the price level people expected and the quantity of output to the natural level of output. The increase in government spending will cause the unemployment rate to the natural rate of unemployment in the short run.
Again, the following graph shows the economy in long-run equilibrium at the expected price level of 120 and the natural level of output of $600 billion, before the increase in government spending on infrastructure.
During the transition from the short run to the long run, price-level expectations will and the curve will shift to the .
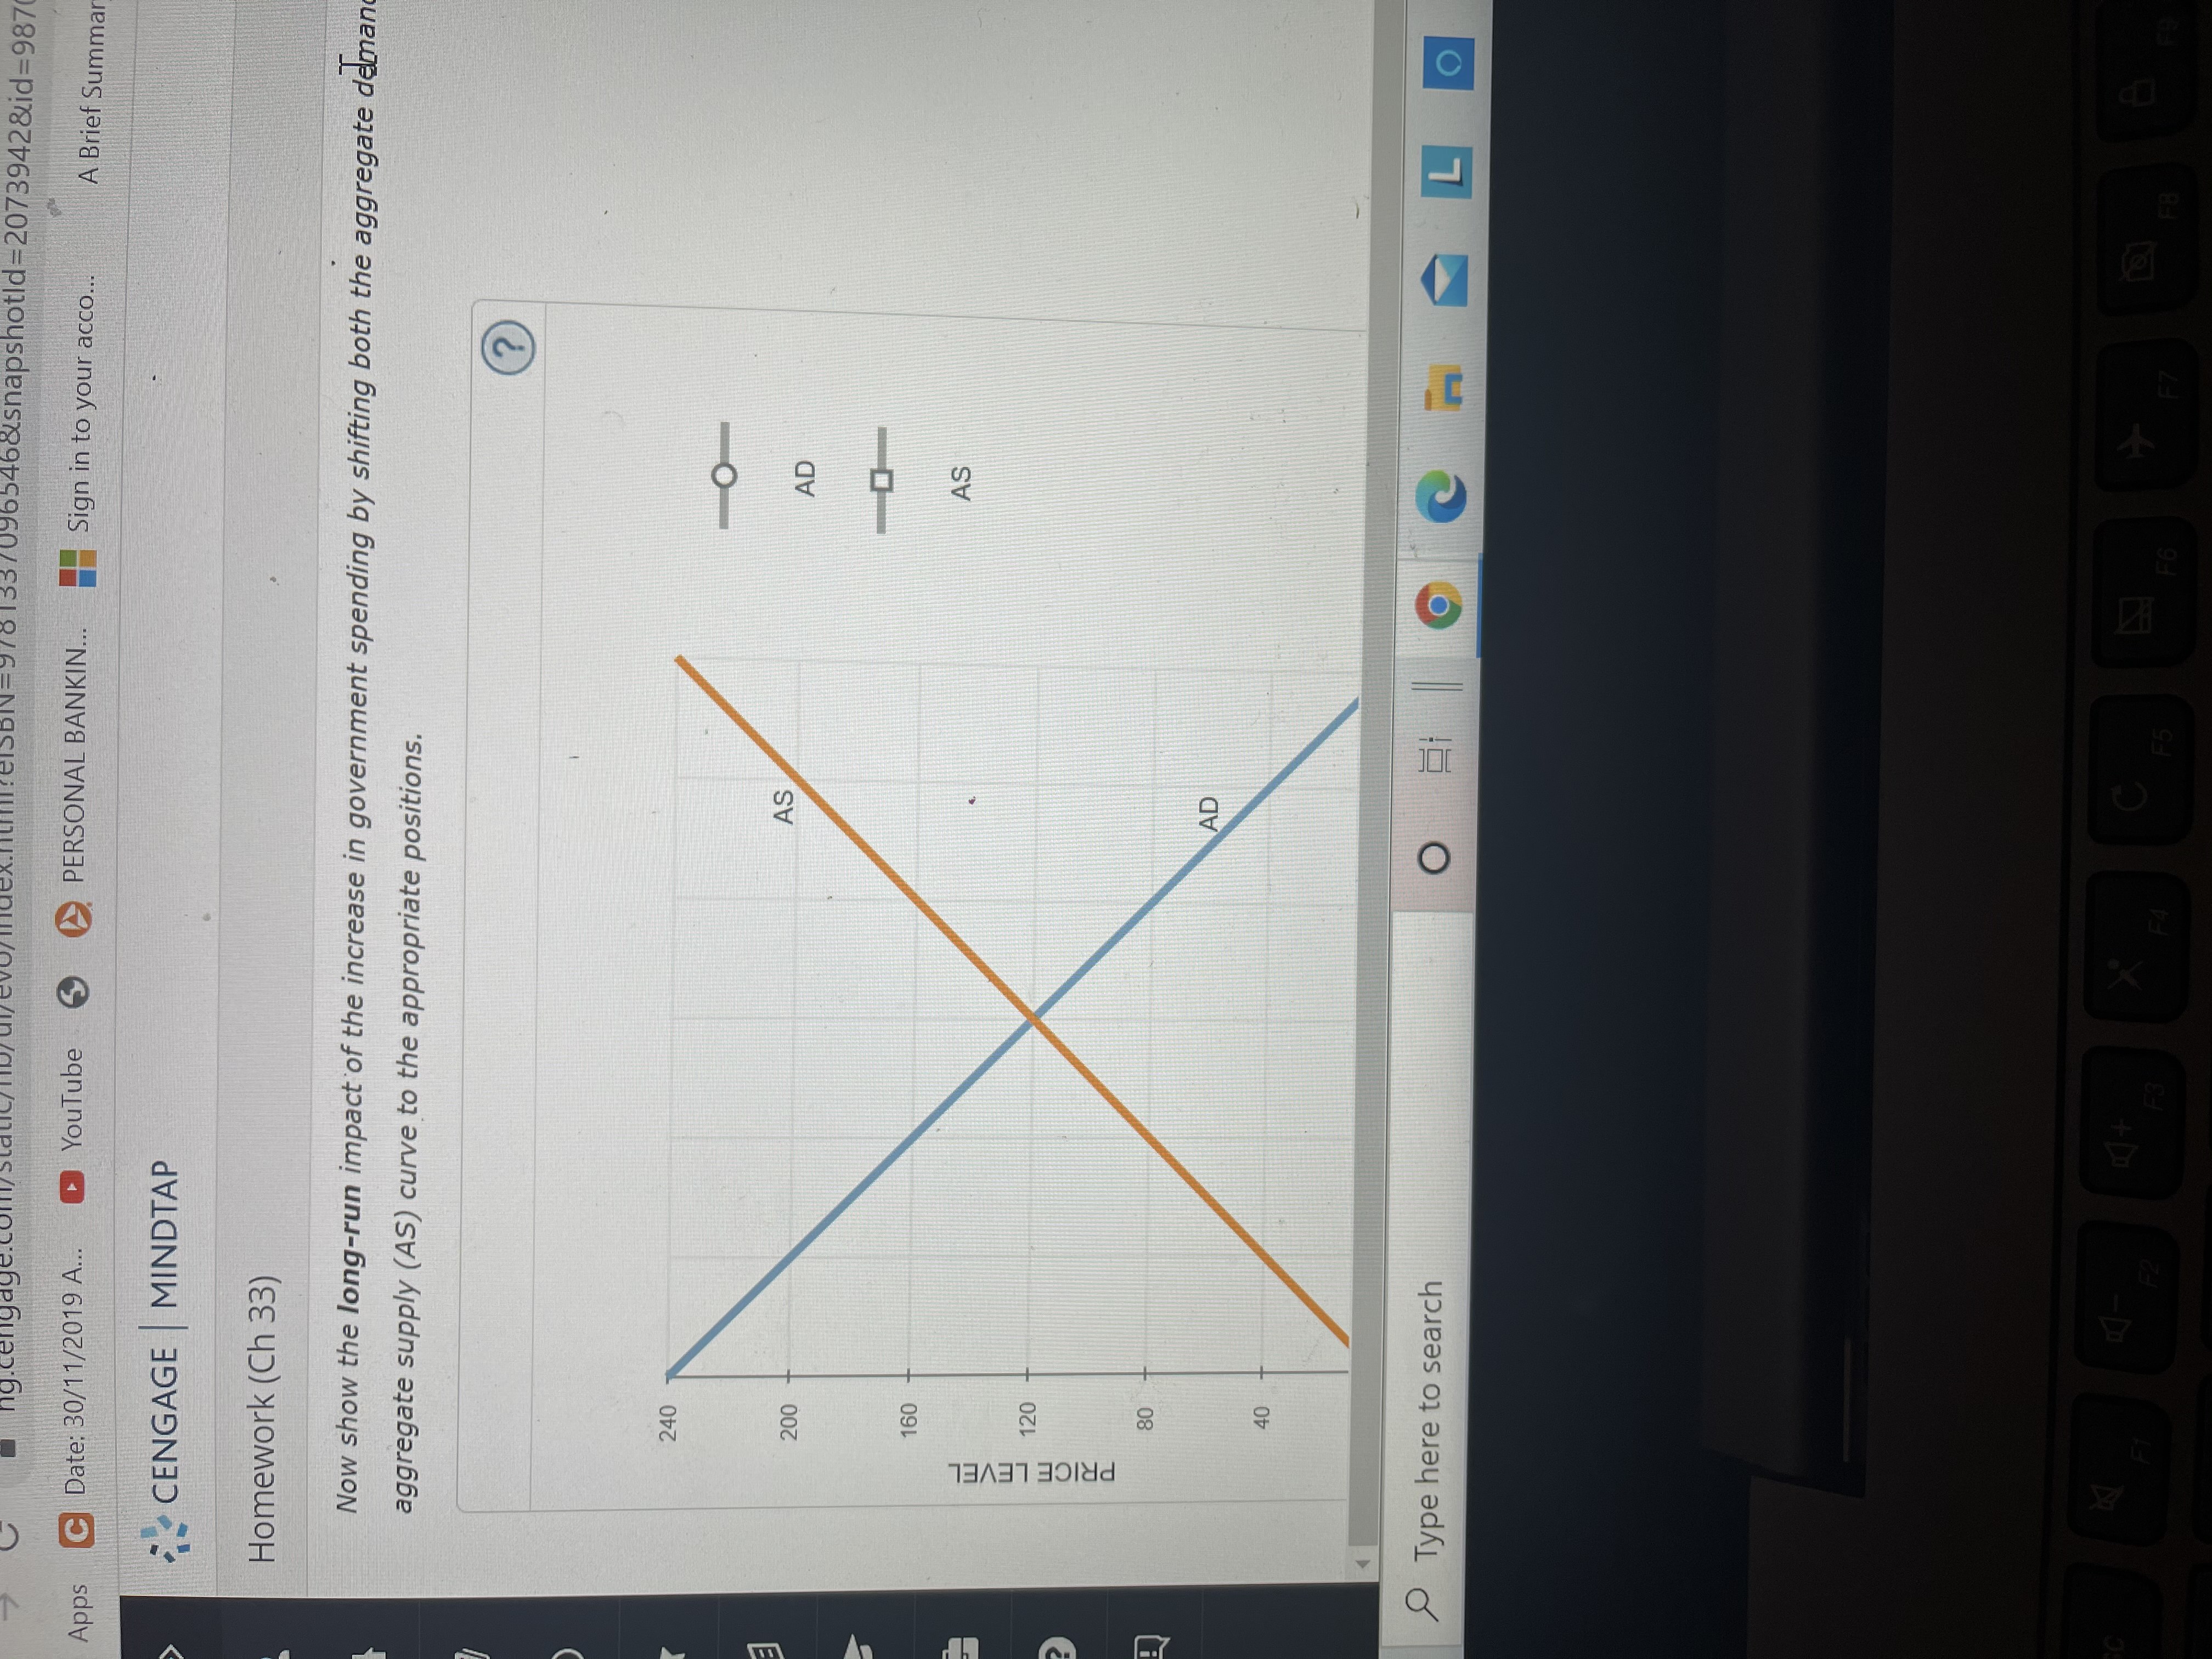
Now show thelong-runimpact of the increase in government spending by shifting both the aggregate demand (AD) curve and the short-run aggregate supply (AS) curve to the appropriate positions.
In the long run, as a result of the increase in government spending, the price level , the quantity of output the natural level of output, and the unemployment rate the natural rate of unemployment.
Step by Step Solution
There are 3 Steps involved in it
Step: 1

Get Instant Access to Expert-Tailored Solutions
See step-by-step solutions with expert insights and AI powered tools for academic success
Step: 2

Step: 3
Ace Your Homework with AI
Get the answers you need in no time with our AI-driven, step-by-step assistance
Get Started
International Economics Theory and Policy
Authors: Paul R. Krugman, Maurice Obstfeld, Marc J. Melitz
9th Edition
ISBN: 978-0132146654, 0132146657, 9780273754091, 978-0273754206