Answered step by step
Verified Expert Solution
Link Copied!

Question

1 Approved Answer

8. In the data demog data.csv, if you model the INCTOT variable as a linear function of the AGE variable, what slope and intercept give
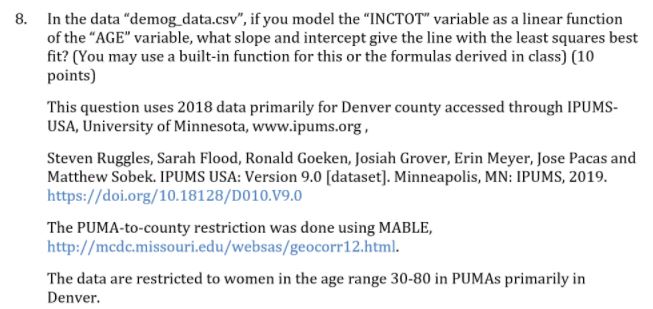
image text in transcribed
8. In the data "demog data.csv", if you model the "INCTOT" variable as a linear function of the "AGE" variable, what slope and intercept give the line with the least squares best fit? (You may use a built-in function for this or the formulas derived in class) (10 points) This question uses 2018 data primarily for Denver county accessed through IPUMS- USA, University of Minnesota, www.ipums.org, Steven Ruggles, Sarah Flood, Ronald Goeken, Josiah Grover, Erin Meyer, Jose Pacas and Matthew Sobek. IPUMS USA: Version 9.0 [dataset]. Minneapolis, MN: IPUMS, 2019. https://doi.org/10.18128/D010.V9.0 The PUMA-to-county restriction was done using MABLE, http://medc.missouri.edu/websas/geocorr12.html. The data are restricted to women in the age range 30-80 in PUMAs primarily in Denver

Step by Step Solution

There are 3 Steps involved in it

Step: 1

blur-text-image

Get Instant Access to Expert-Tailored Solutions

See step-by-step solutions with expert insights and AI powered tools for academic success

Step: 2

blur-text-image

Step: 3

blur-text-image

Ace Your Homework with AI

Get the answers you need in no time with our AI-driven, step-by-step assistance

Get Started

Recommended Textbook for

Elementary Algebra

Authors: Charles P McKeague

3rd Edition

1483263843, 9781483263847

More Books

Students also viewed these Mathematics questions