

Answered step by step
Verified Expert Solution
Question
1 Approved Answer
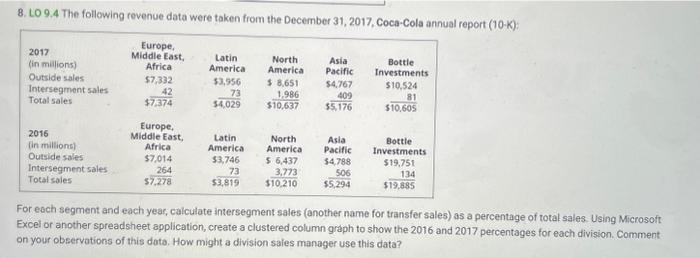
8. L0 9.4 The following revenue data were taken from the December 31,2017 , Coca-Cola annual report (10K) : For each segment and each year,
Step by Step Solution
There are 3 Steps involved in it
Step: 1

Get Instant Access to Expert-Tailored Solutions
See step-by-step solutions with expert insights and AI powered tools for academic success
Step: 2

Step: 3
Ace Your Homework with AI
Get the answers you need in no time with our AI-driven, step-by-step assistance
Get Started
The Productivity Audit
Authors: Mark Spelman, Paul Spence
1st Edition
1907766073, 978-1907766077