Question
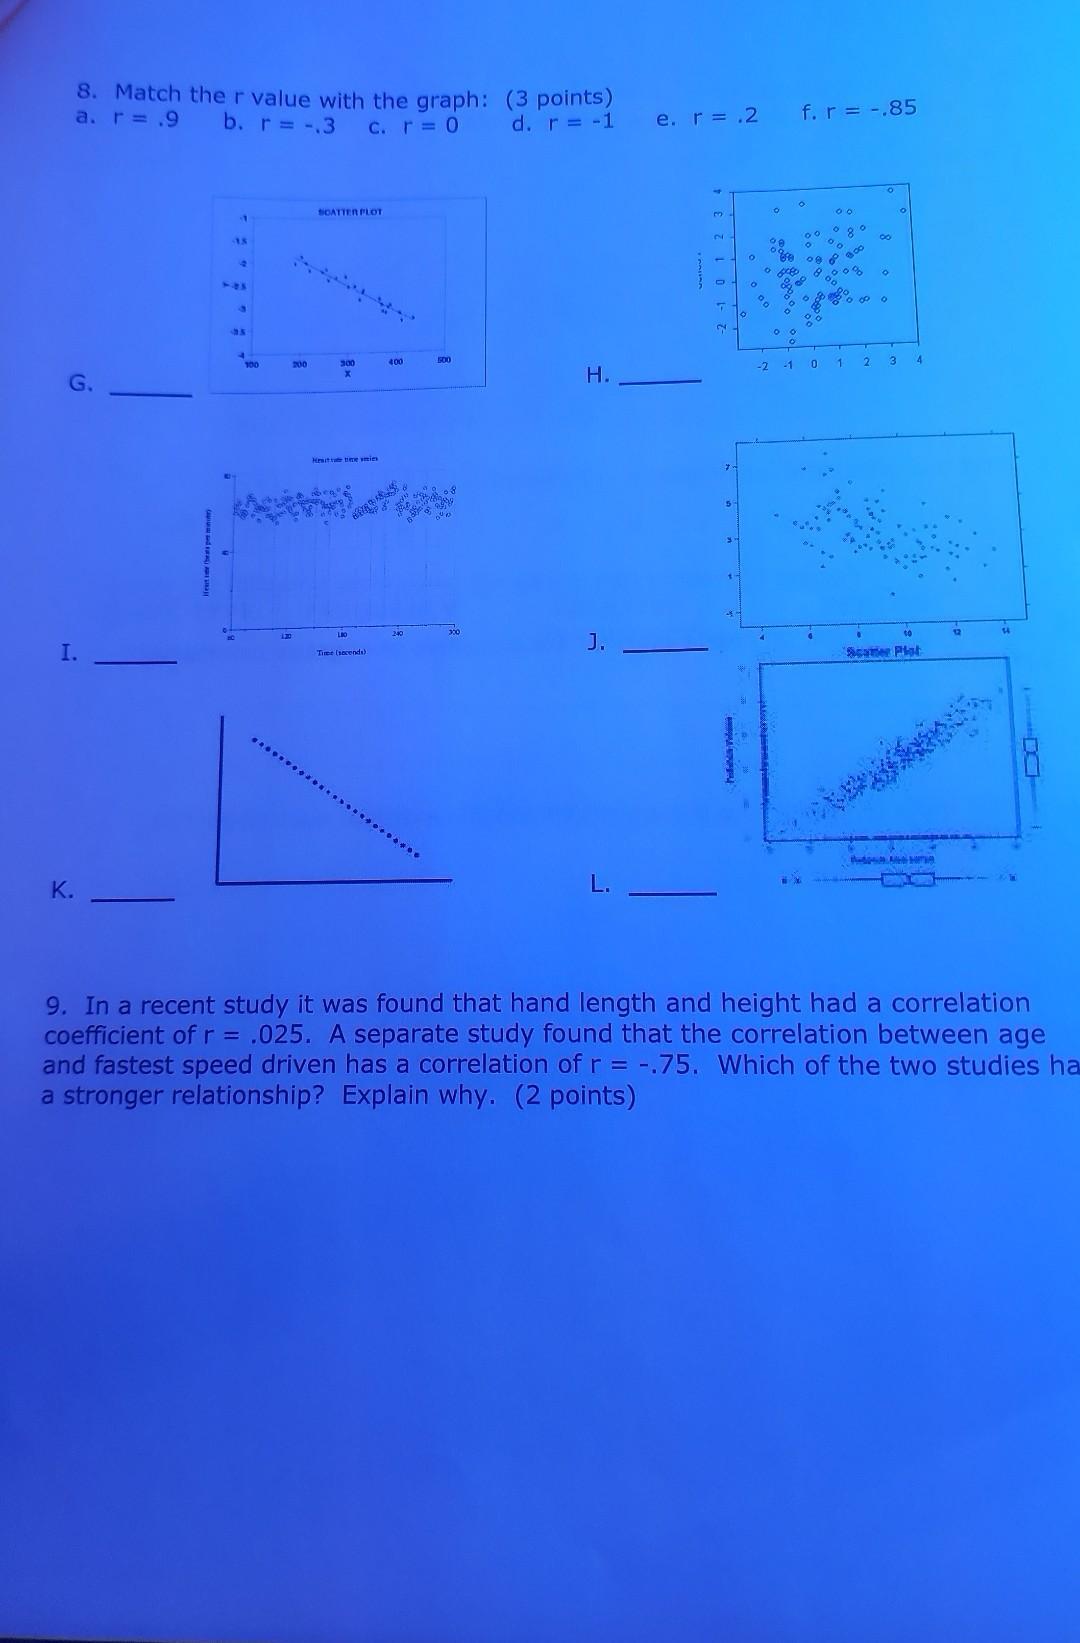
8. Match the r value with the graph: (3 points) a. r= .9 b. r = -.3 c. r = 0 d. r =

8. Match the r value with the graph: (3 points) a. r= .9 b. r = -.3 c. r = 0 d. r = -1 I. K. 1 6 25 4 100 200 SCATTER PLOT 300 Hesite teis Time (seconds) 400 500 H. J. e. r = .2 B O Pel O O % O f. r = -.85 O A B09 608 of o O 00 % 09 & O 4 00 00 200 0% 20 820000 -2 -1 0 1 2 3 4 Scatter Plot -GHIA 14 9. In a recent study it was found that hand length and height had correlation coefficient of r= .025. A separate study found that the correlation between age and fastest speed driven has a correlation of r = -.75. Which of the two studies ha a stronger relationship? Explain why. (2 points)
Step by Step Solution
3.40 Rating (159 Votes )
There are 3 Steps involved in it
Step: 1
Explanation if the points on the plot make a straight li...
Get Instant Access to Expert-Tailored Solutions
See step-by-step solutions with expert insights and AI powered tools for academic success
Step: 2

Step: 3

Ace Your Homework with AI
Get the answers you need in no time with our AI-driven, step-by-step assistance
Get StartedRecommended Textbook for
Fundamentals Of Digital Logic With Verilog Design
Authors: Stephen Brown, Zvonko Vranesic
3rd Edition
978-0073380544, 0073380547
Students also viewed these Accounting questions
Question
Answered: 1 week ago
Question
Answered: 1 week ago
Question
Answered: 1 week ago
Question
Answered: 1 week ago
Question
Answered: 1 week ago
Question
Answered: 1 week ago
Question
Answered: 1 week ago
Question
Answered: 1 week ago
Question
Answered: 1 week ago
Question
Answered: 1 week ago
Question
Answered: 1 week ago
Question
Answered: 1 week ago
Question
Answered: 1 week ago
Question
Answered: 1 week ago
Question
Answered: 1 week ago
Question
Answered: 1 week ago
Question
Answered: 1 week ago
Question
Answered: 1 week ago
Question
Answered: 1 week ago
Question
Answered: 1 week ago
Question
Answered: 1 week ago
View Answer in SolutionInn App


