8 questions
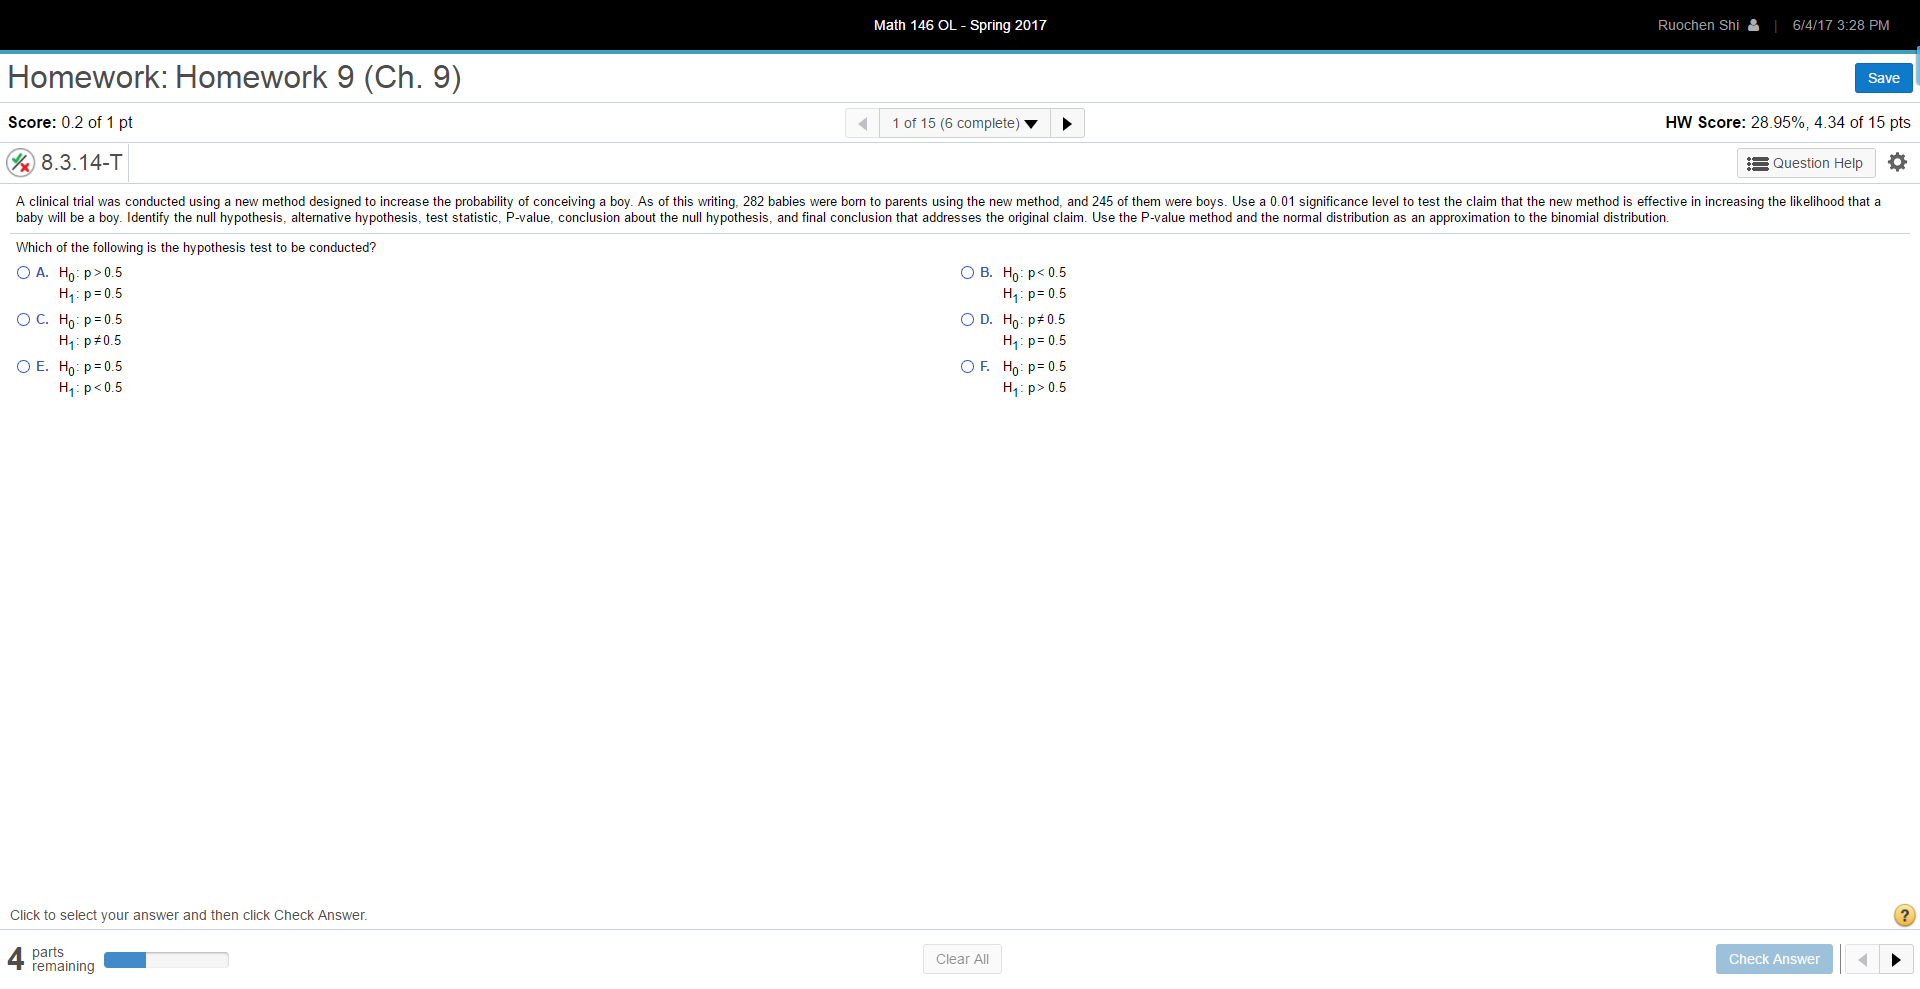
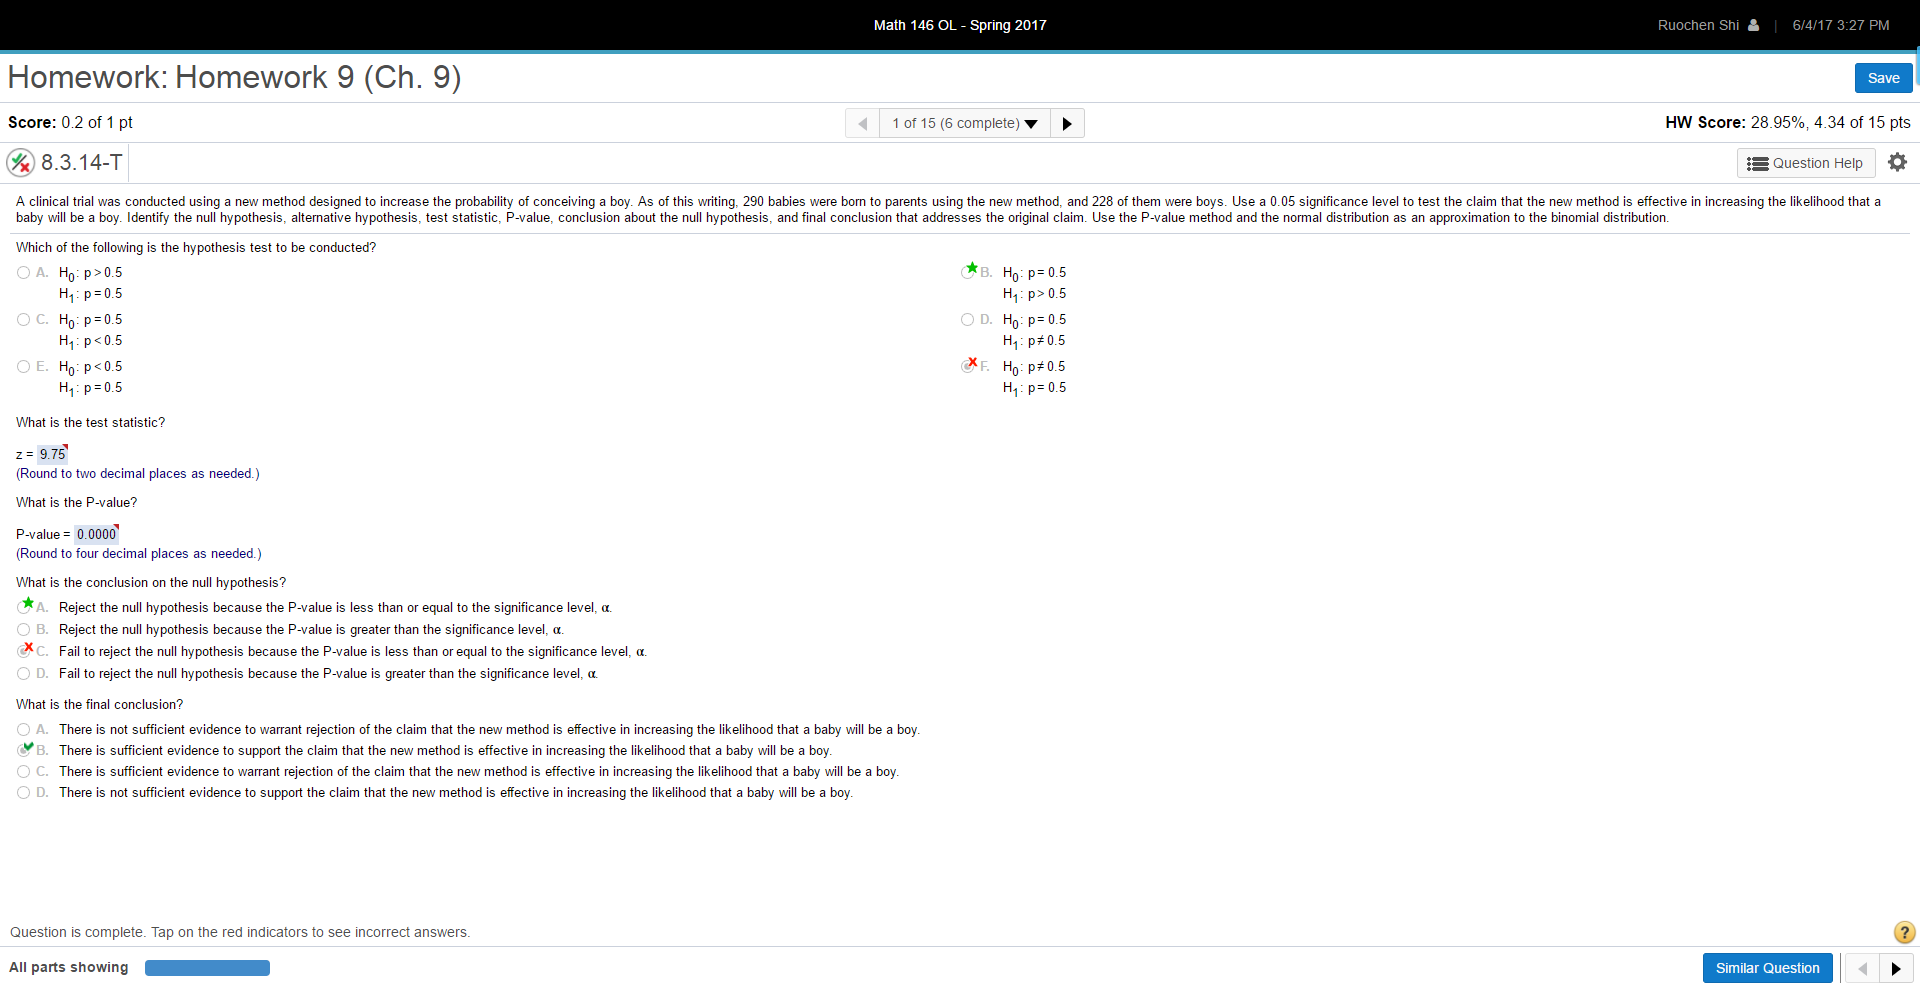
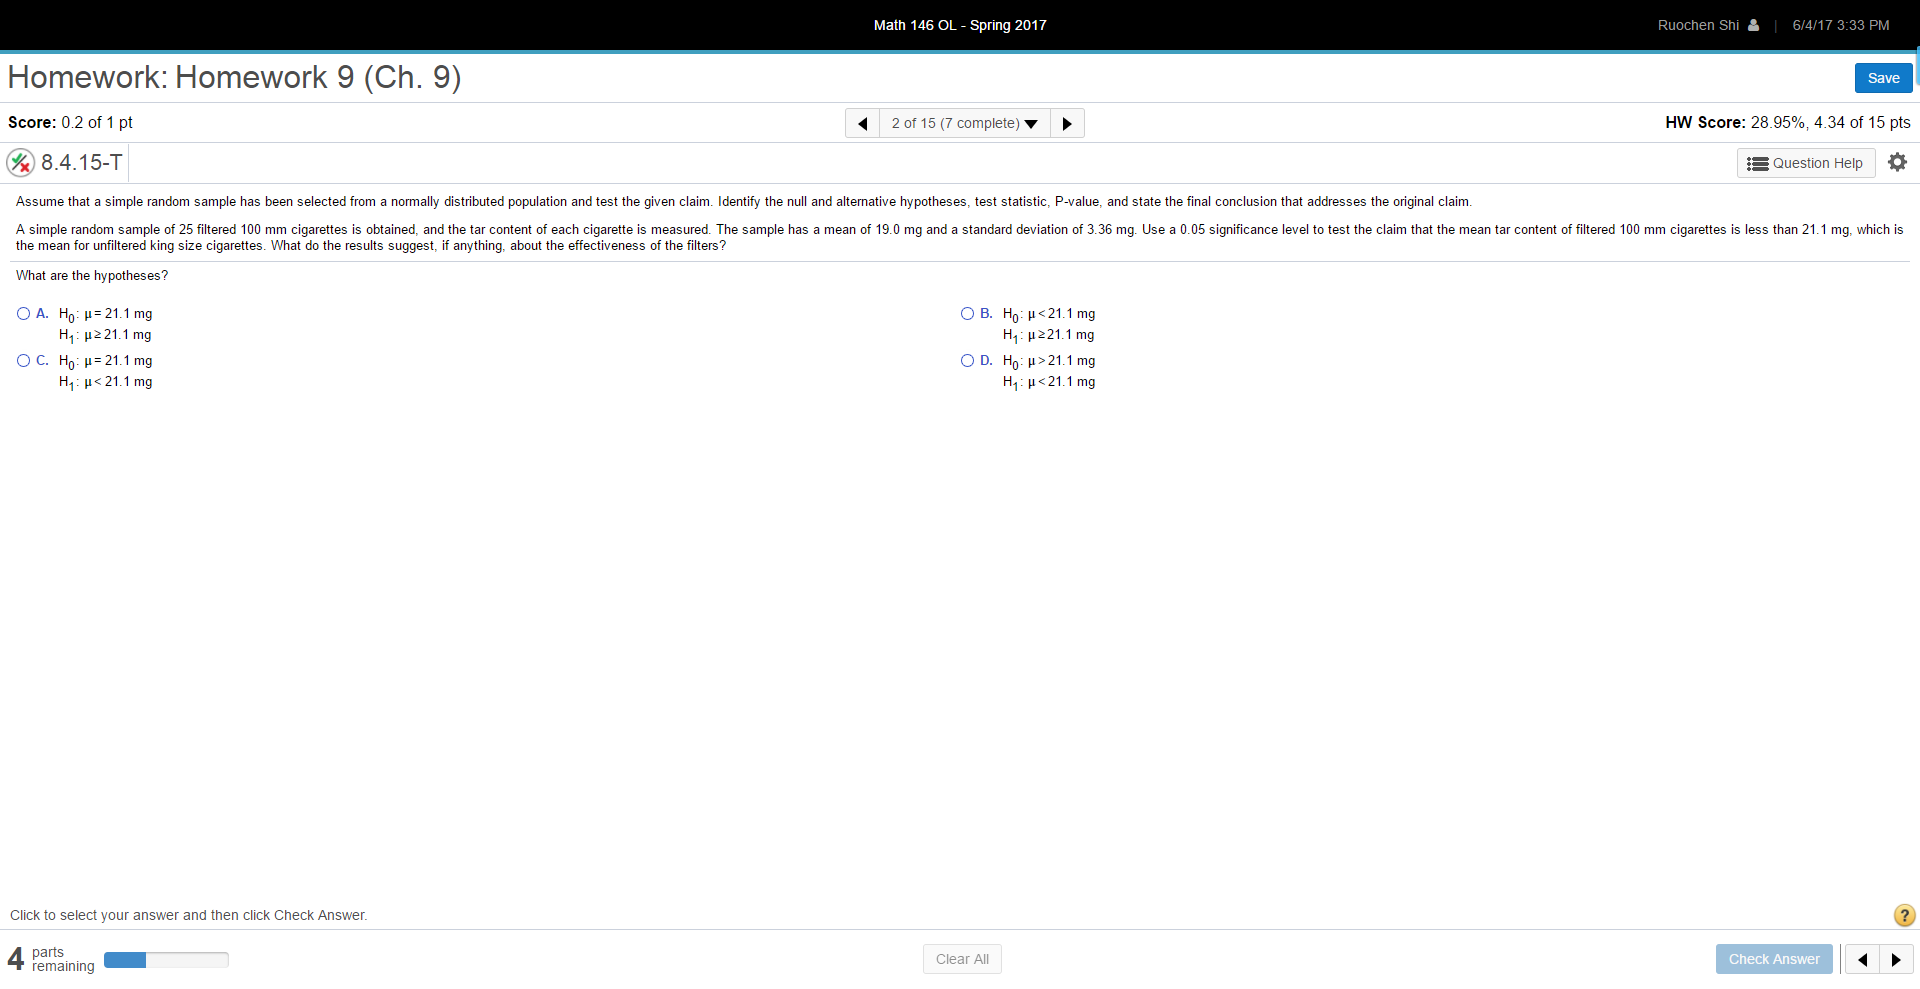
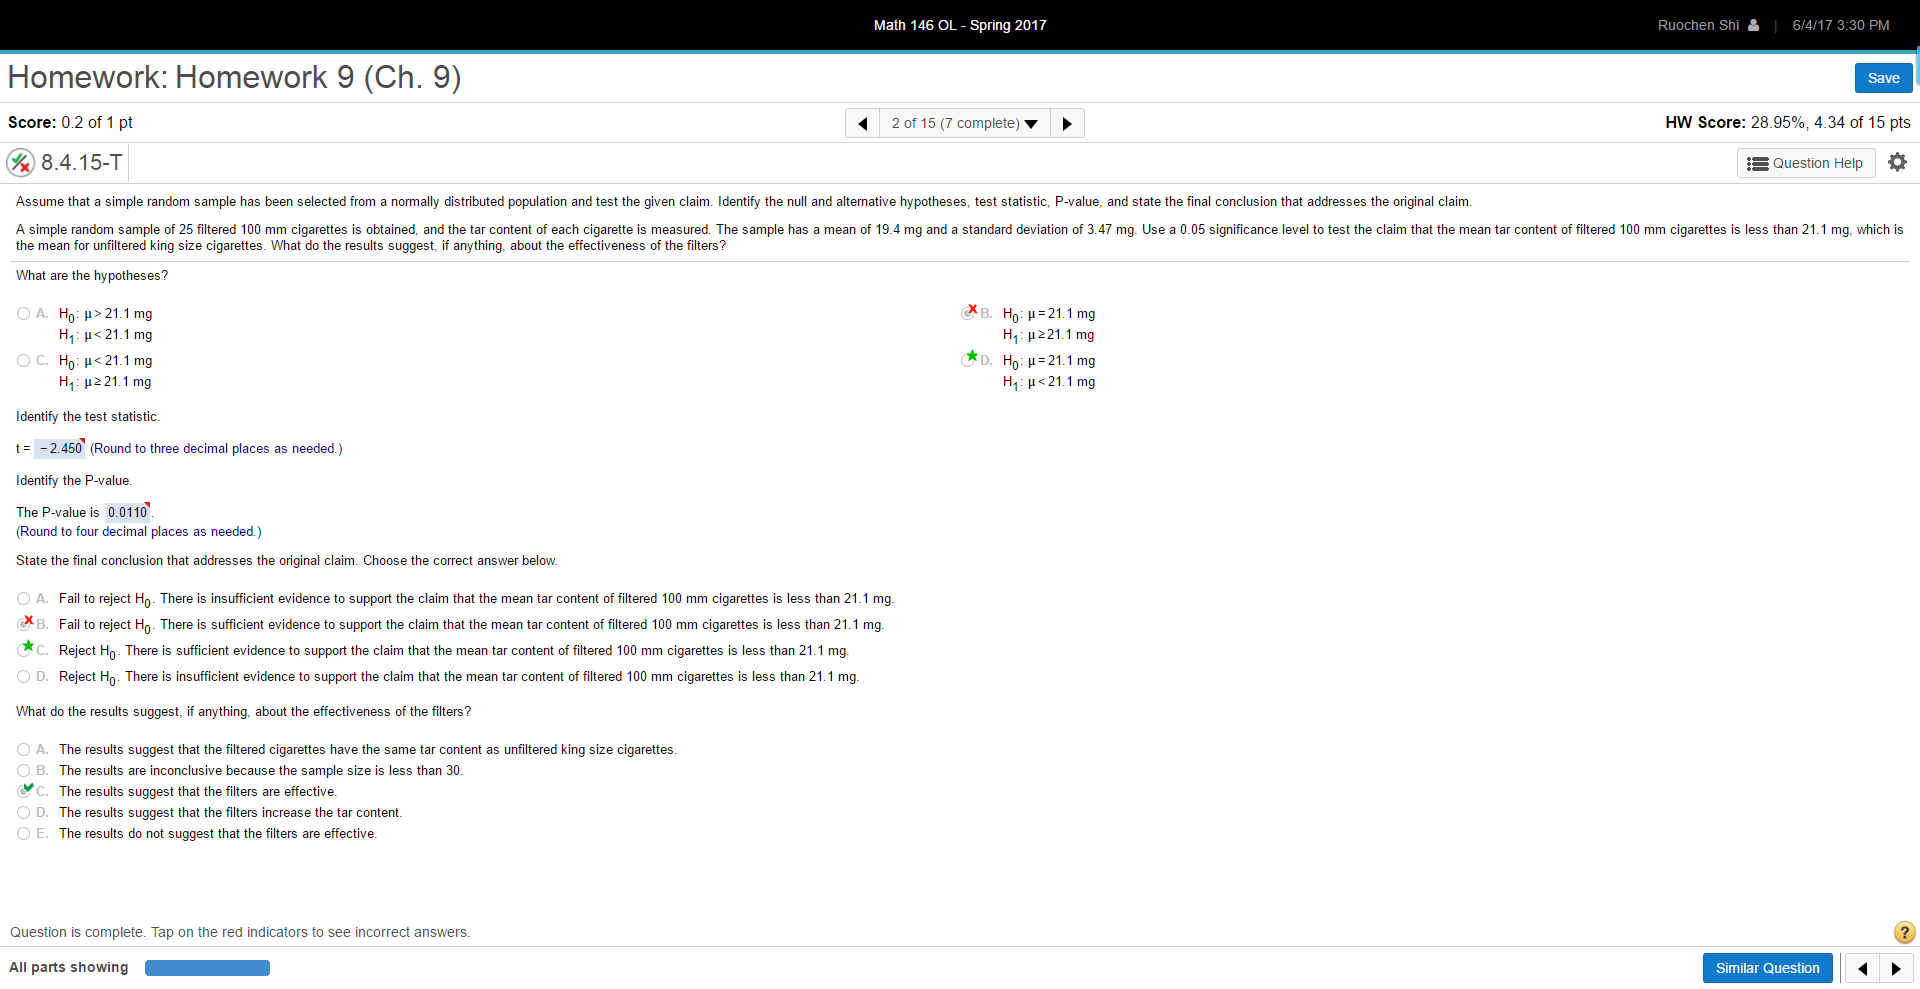
like using all the steps of 1 to be completed for 1(2).
1 and 1 (2) are same question, but different number in question.
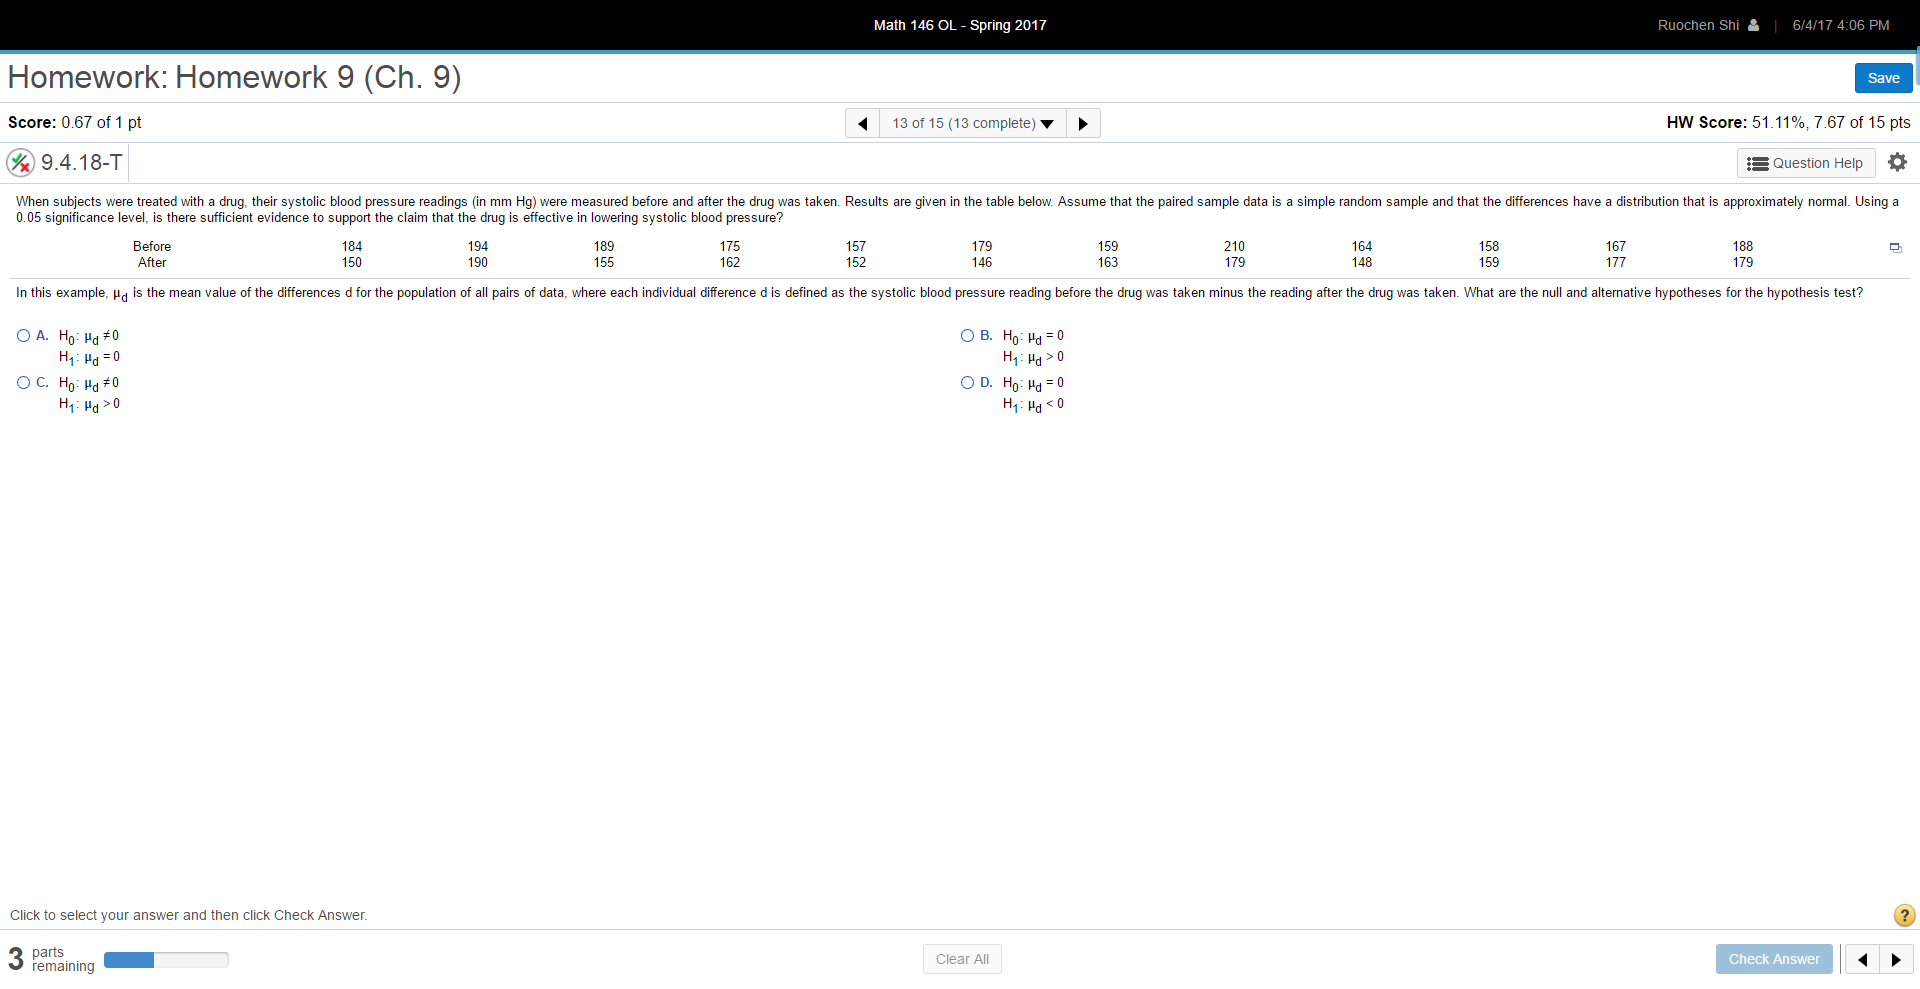
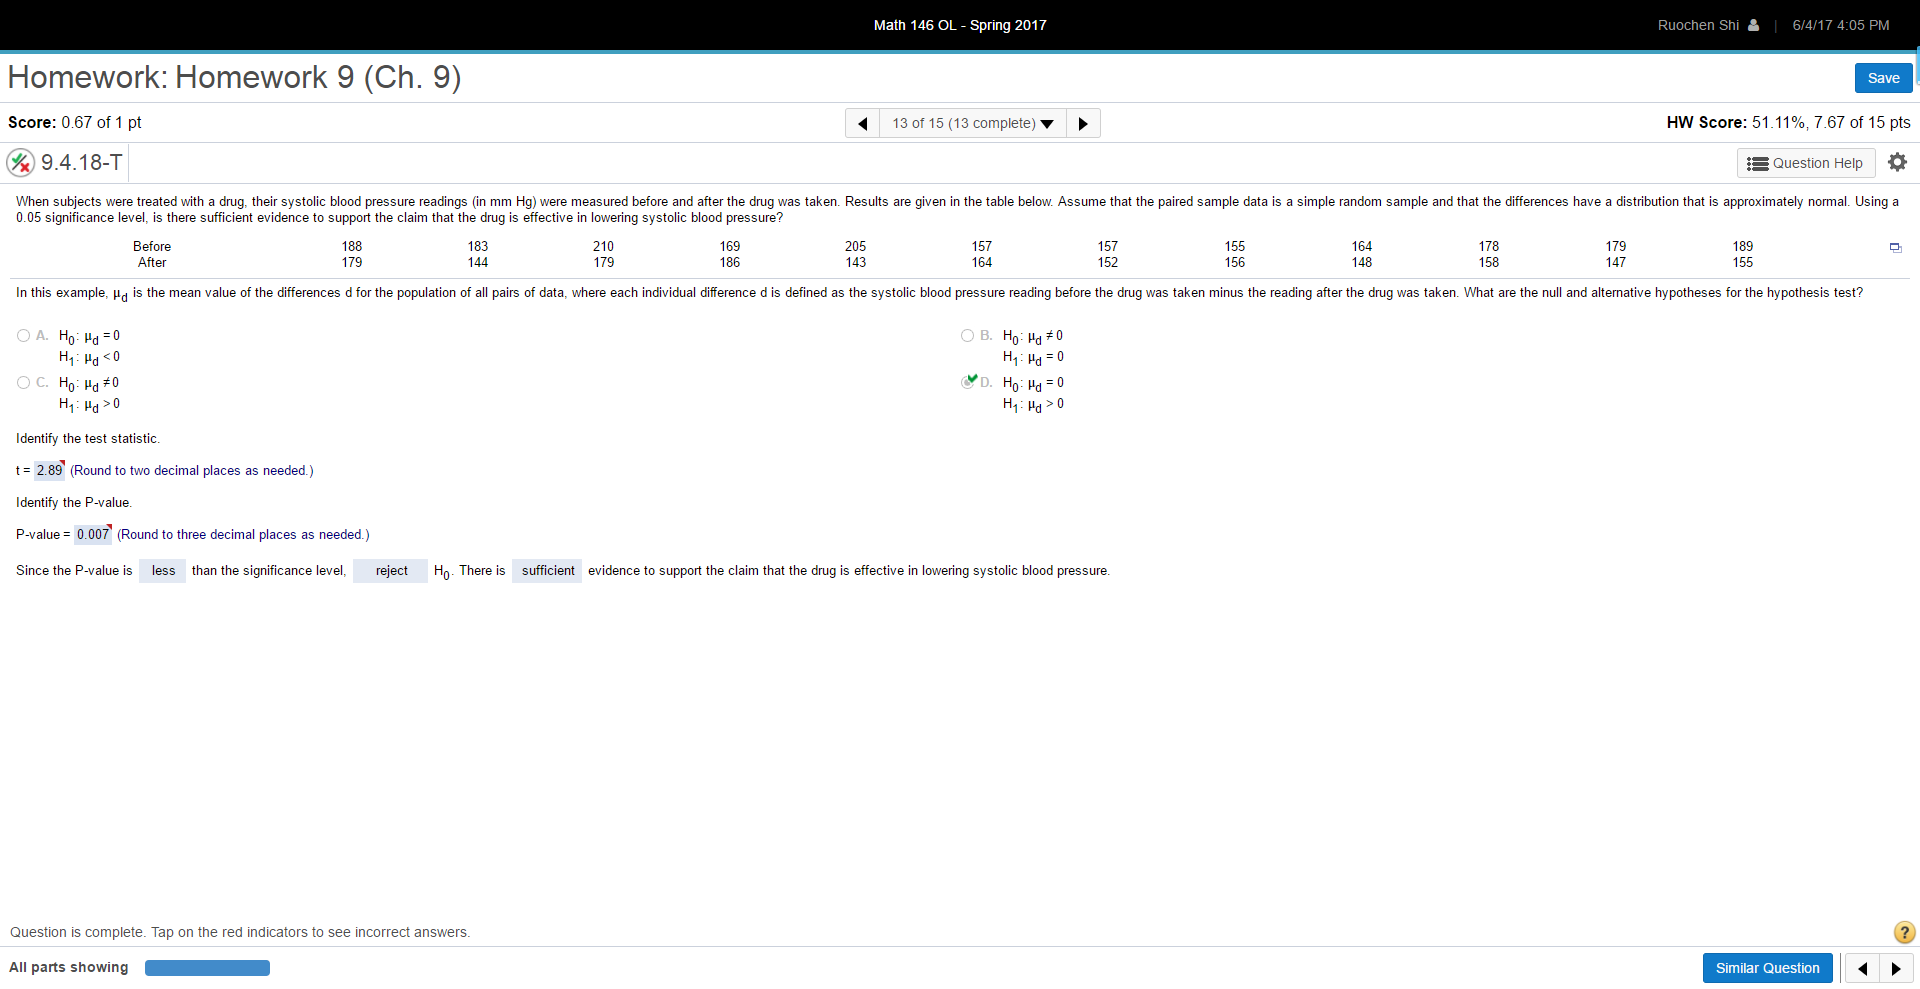
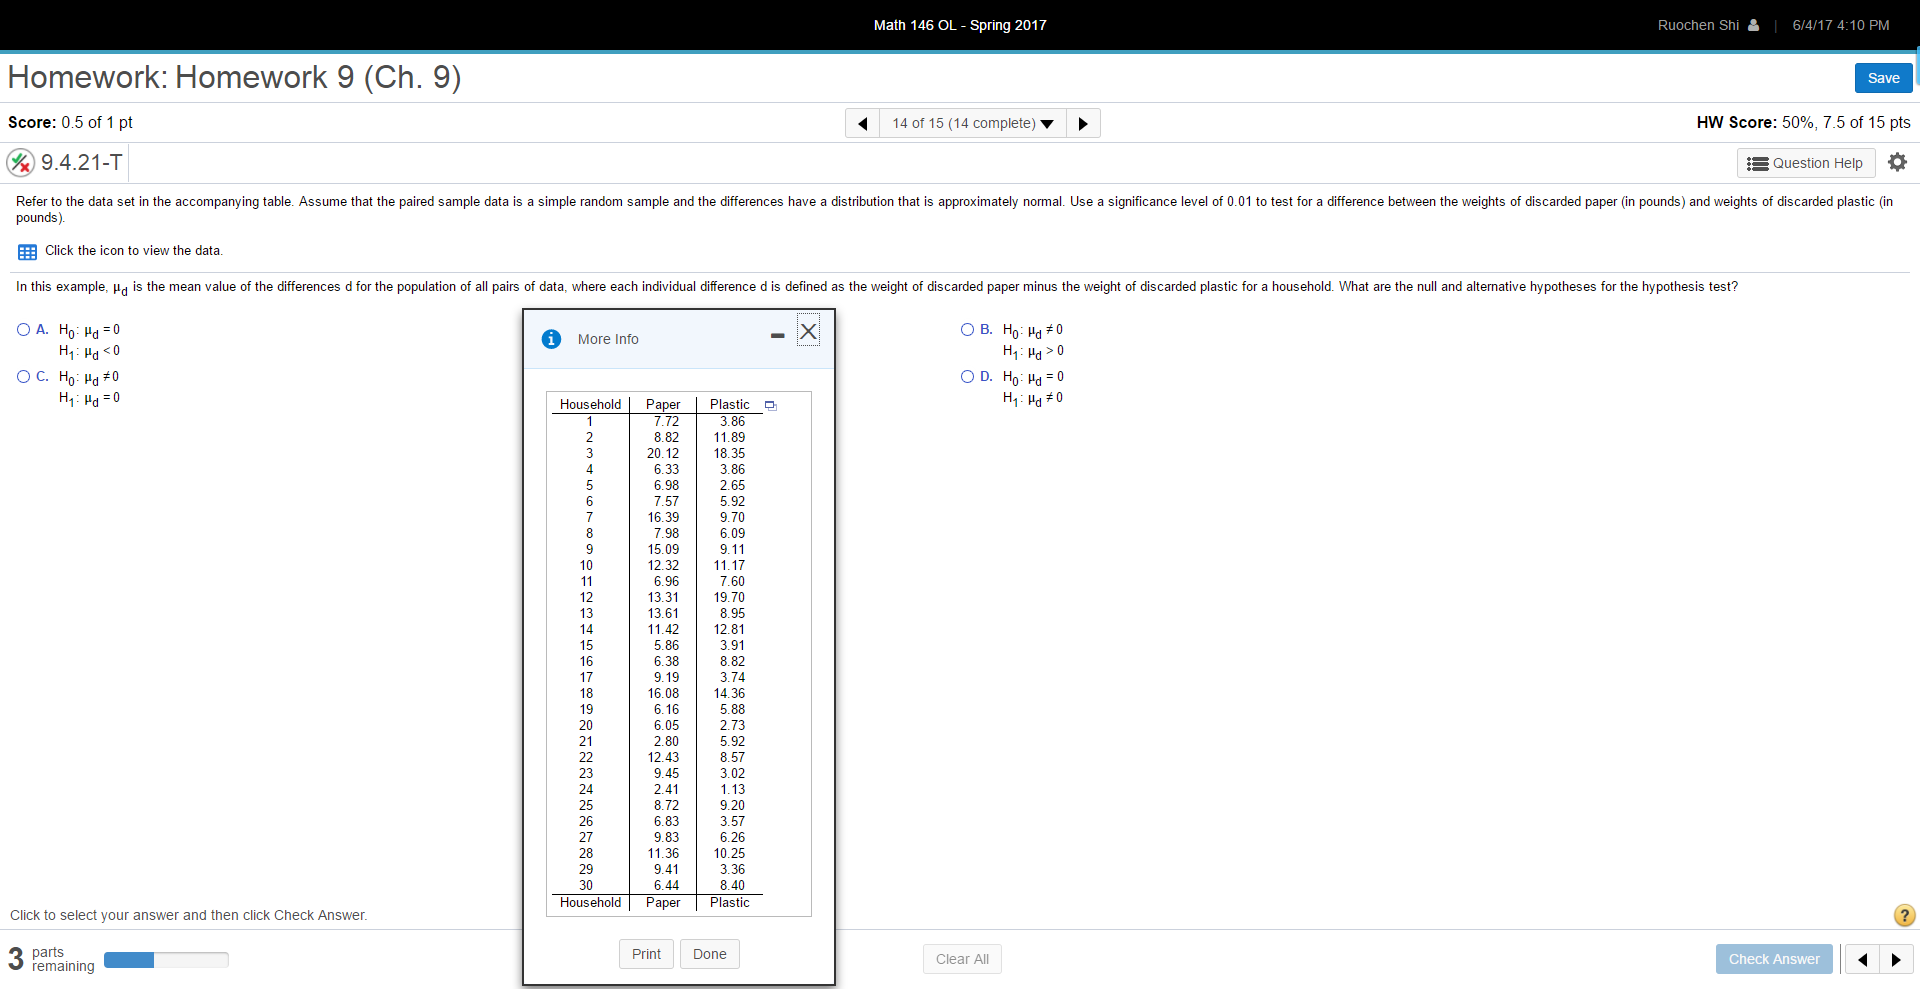
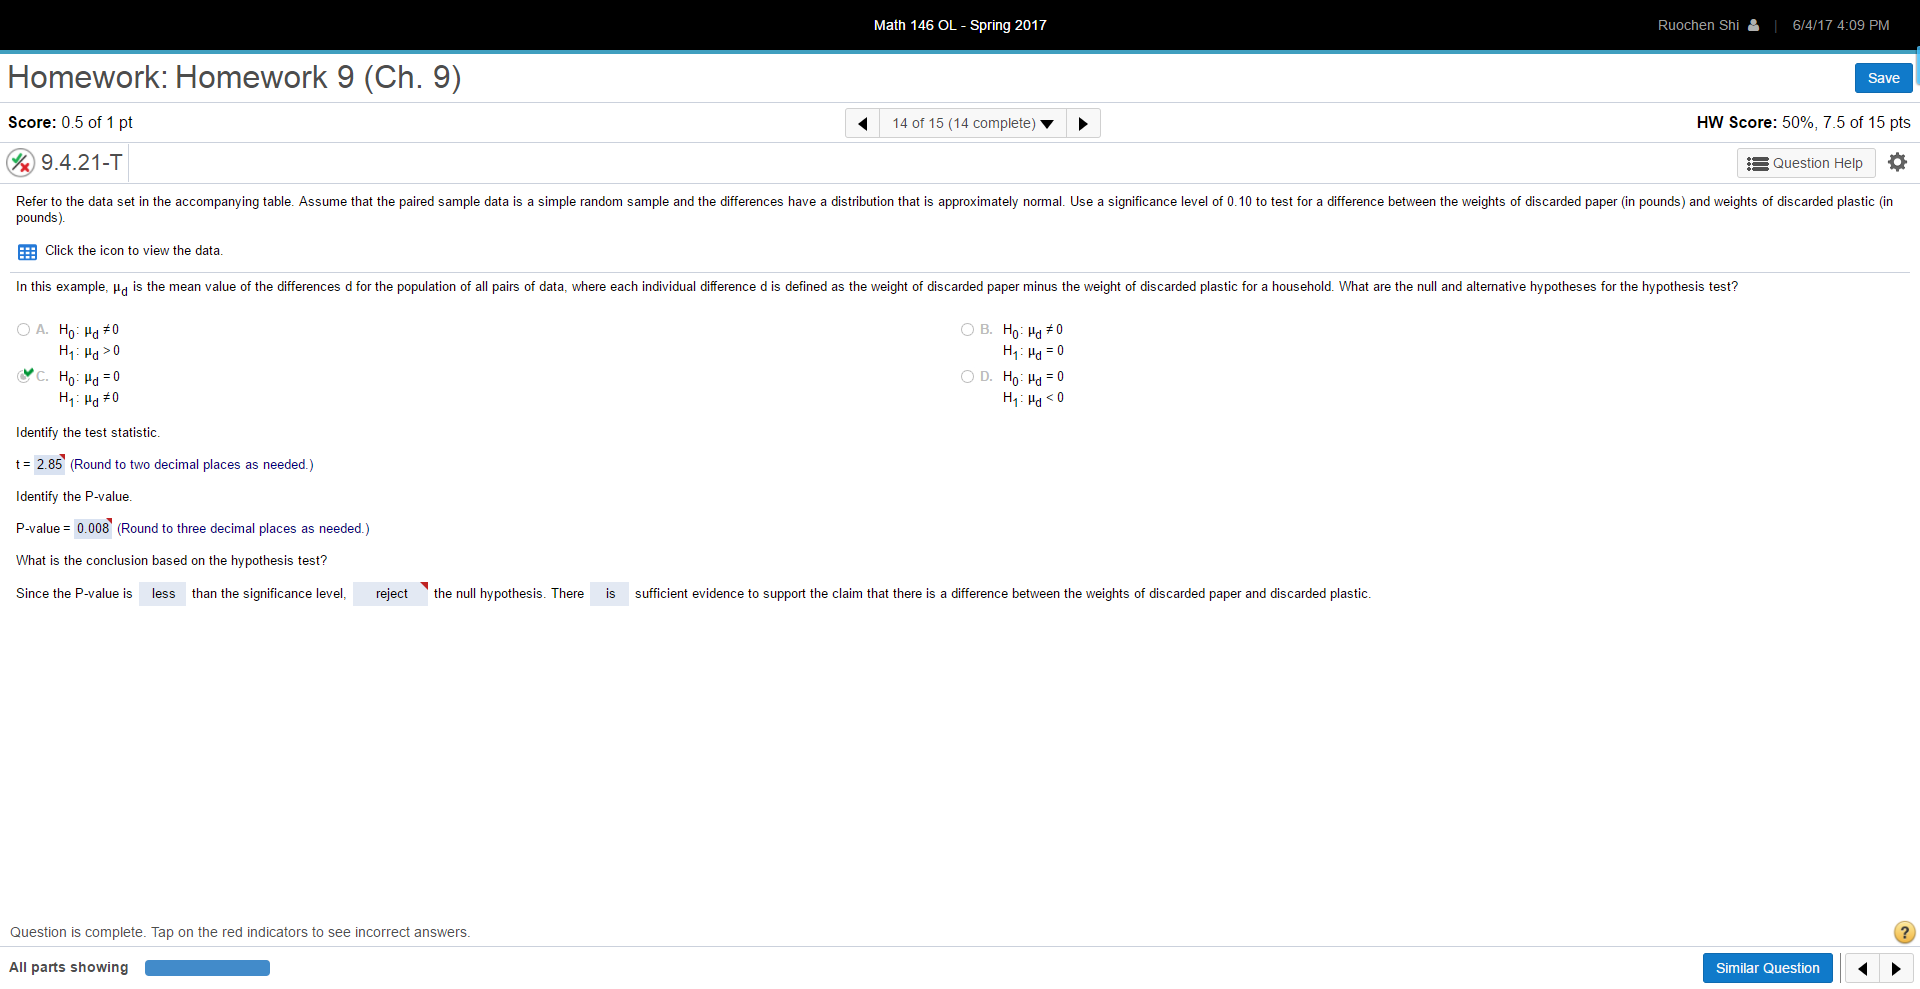
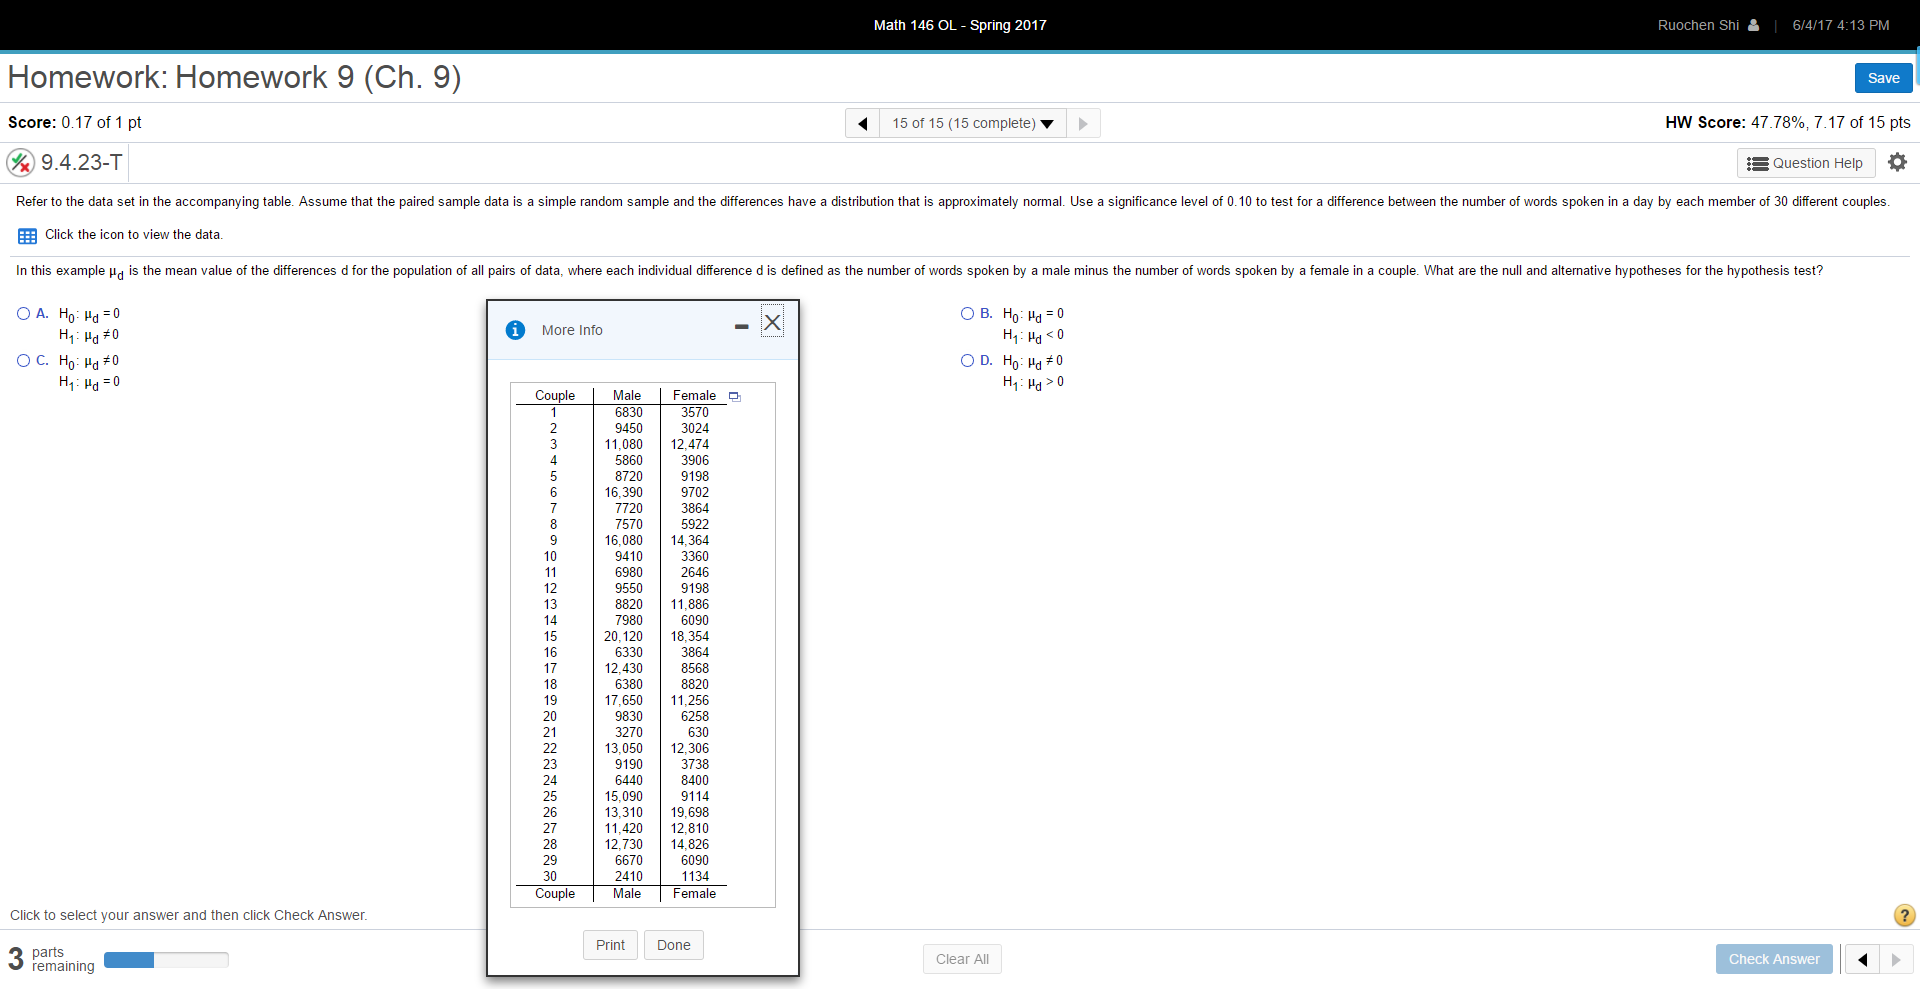
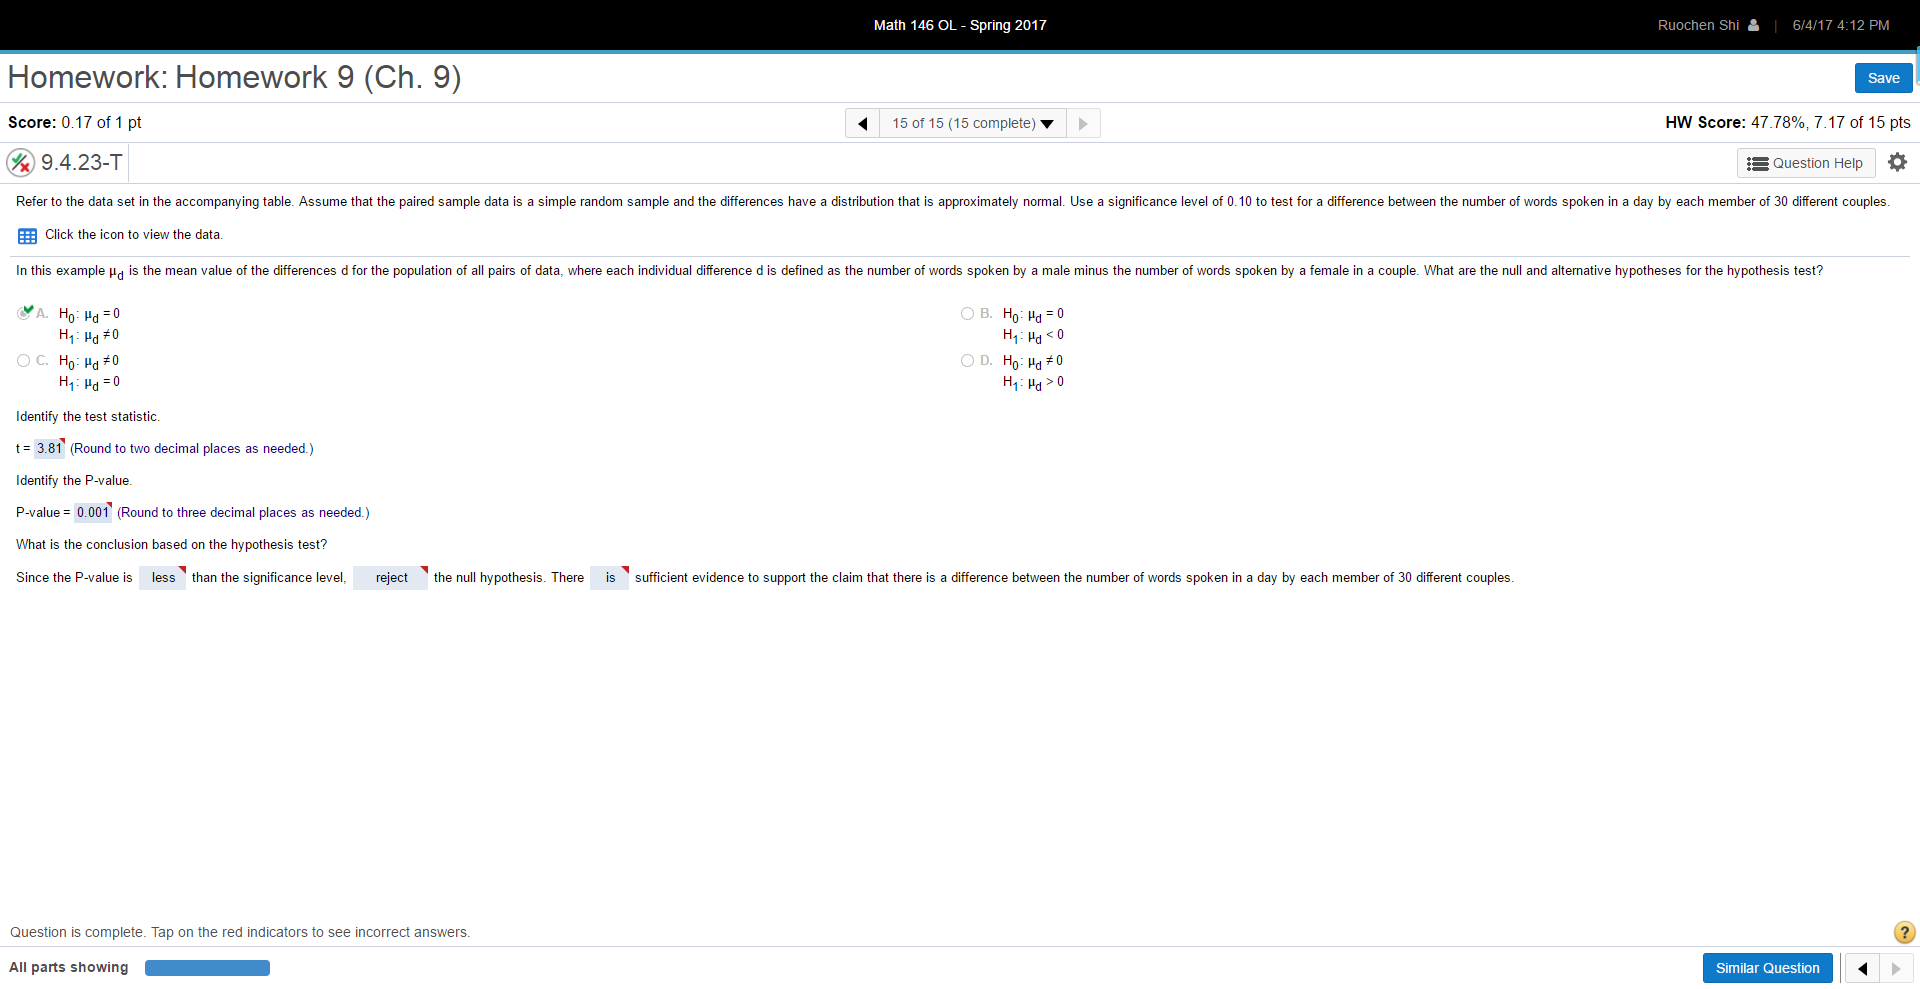
I need the answer for 1 (2). all the step show on 1.
And please show me work on Excel.
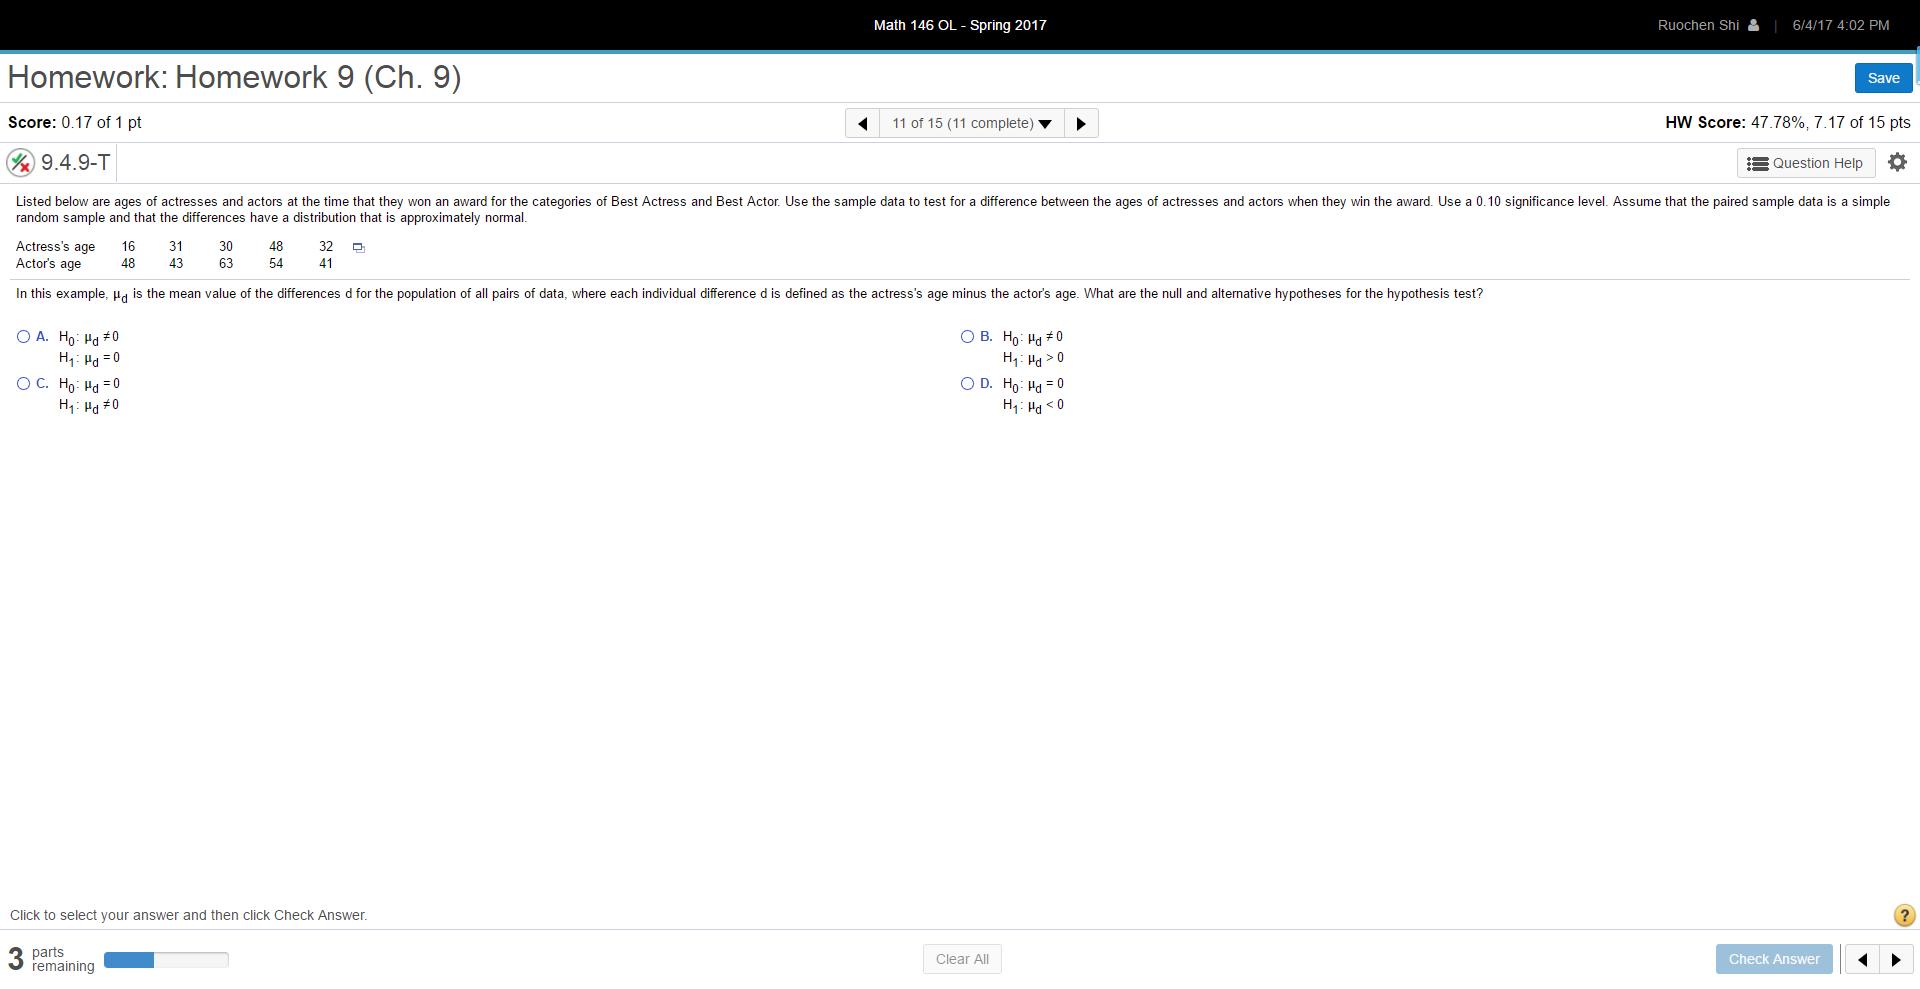
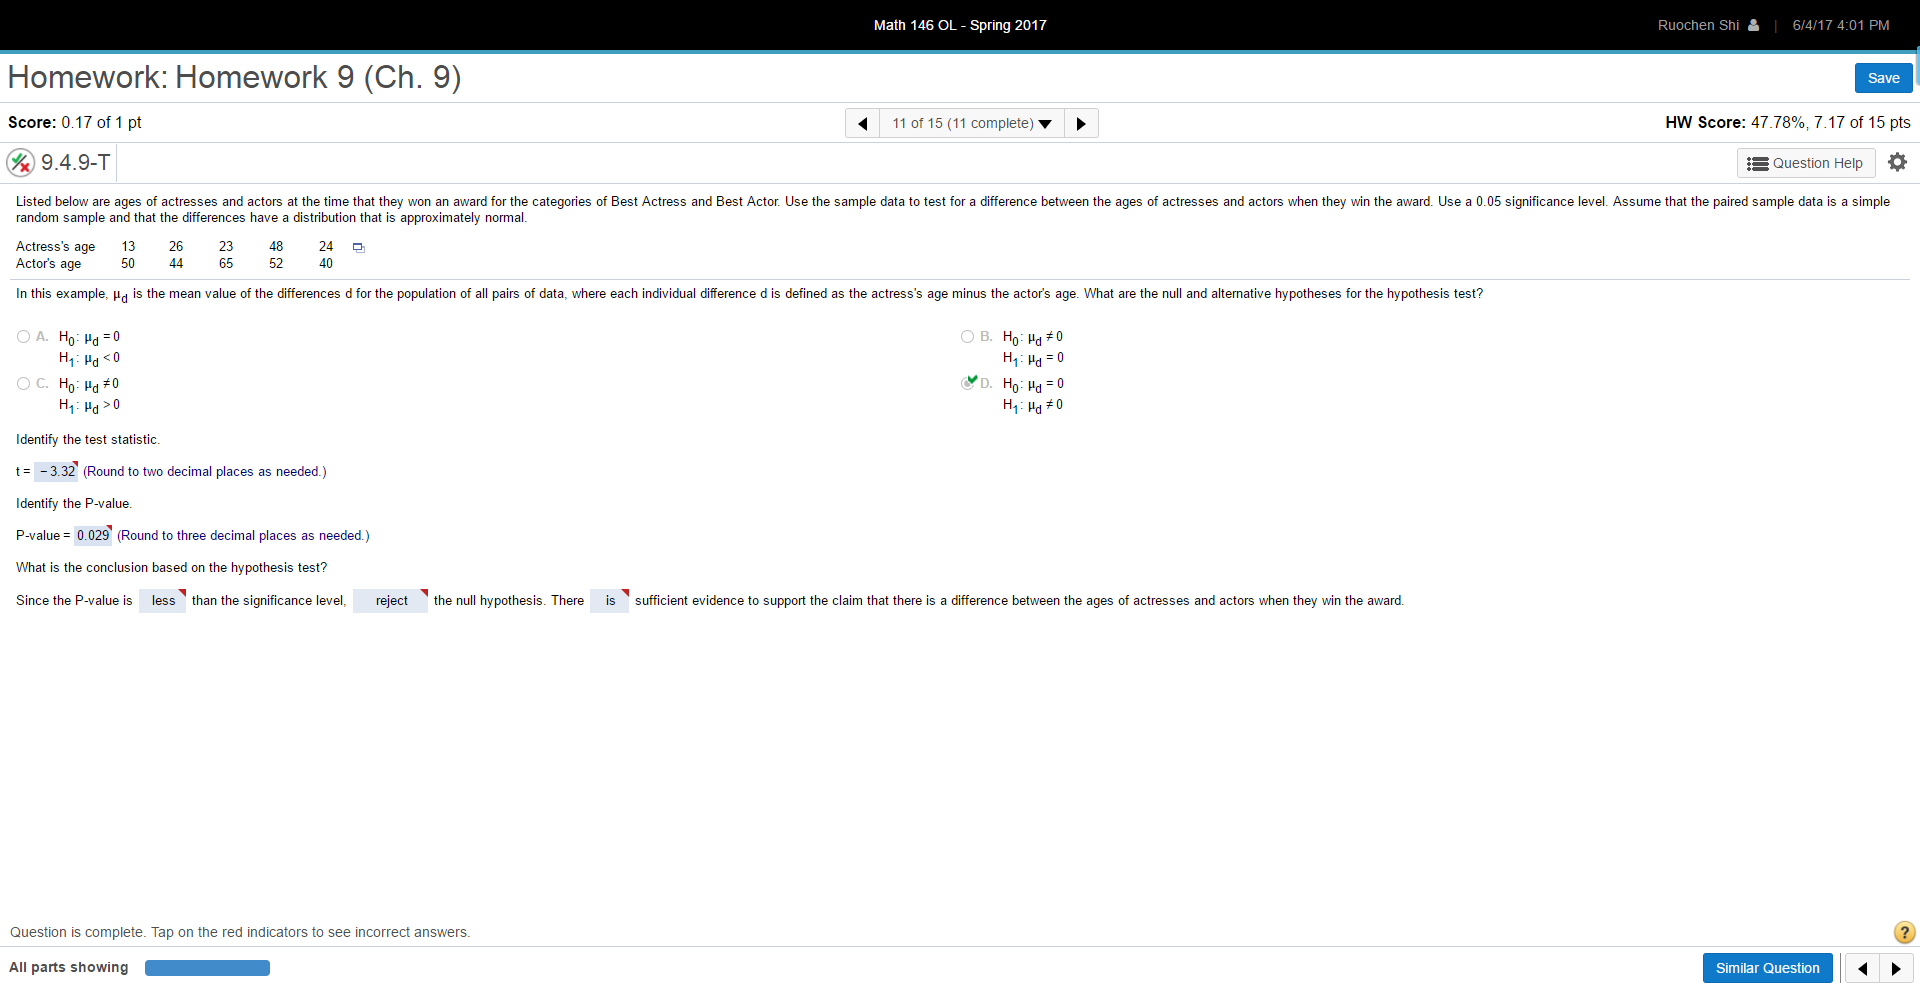
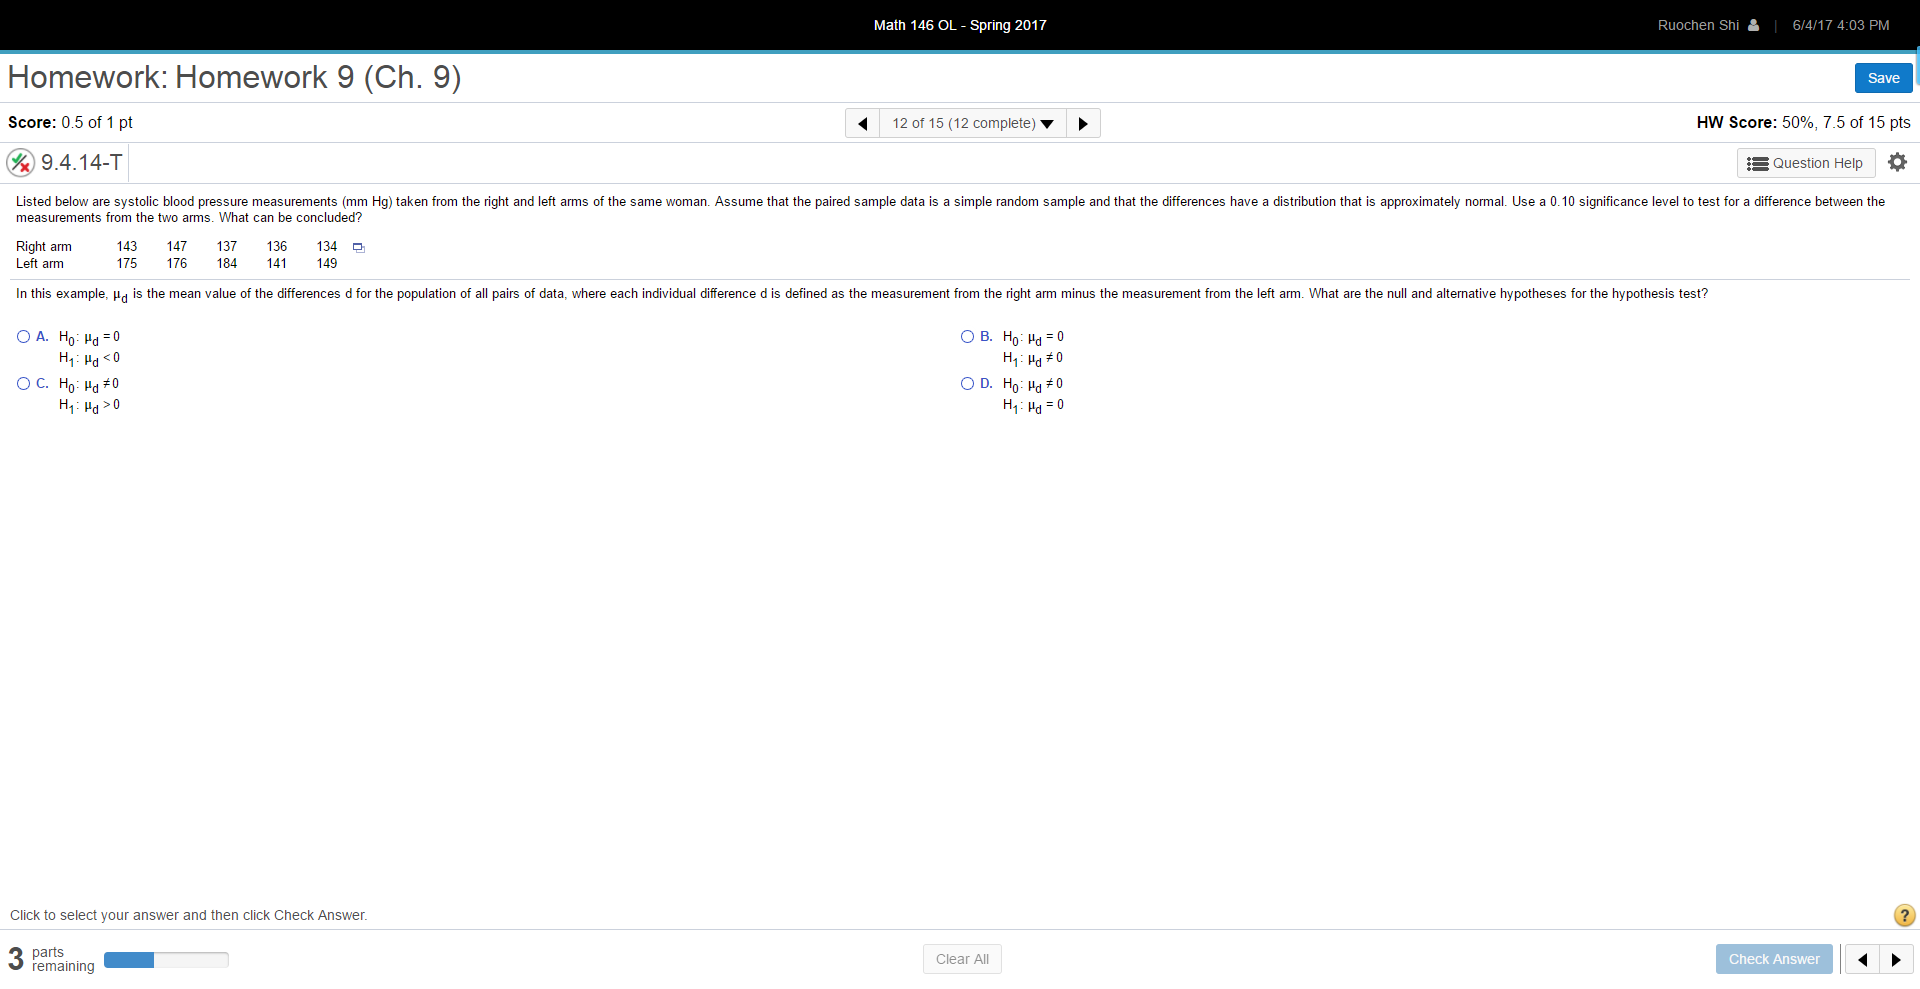
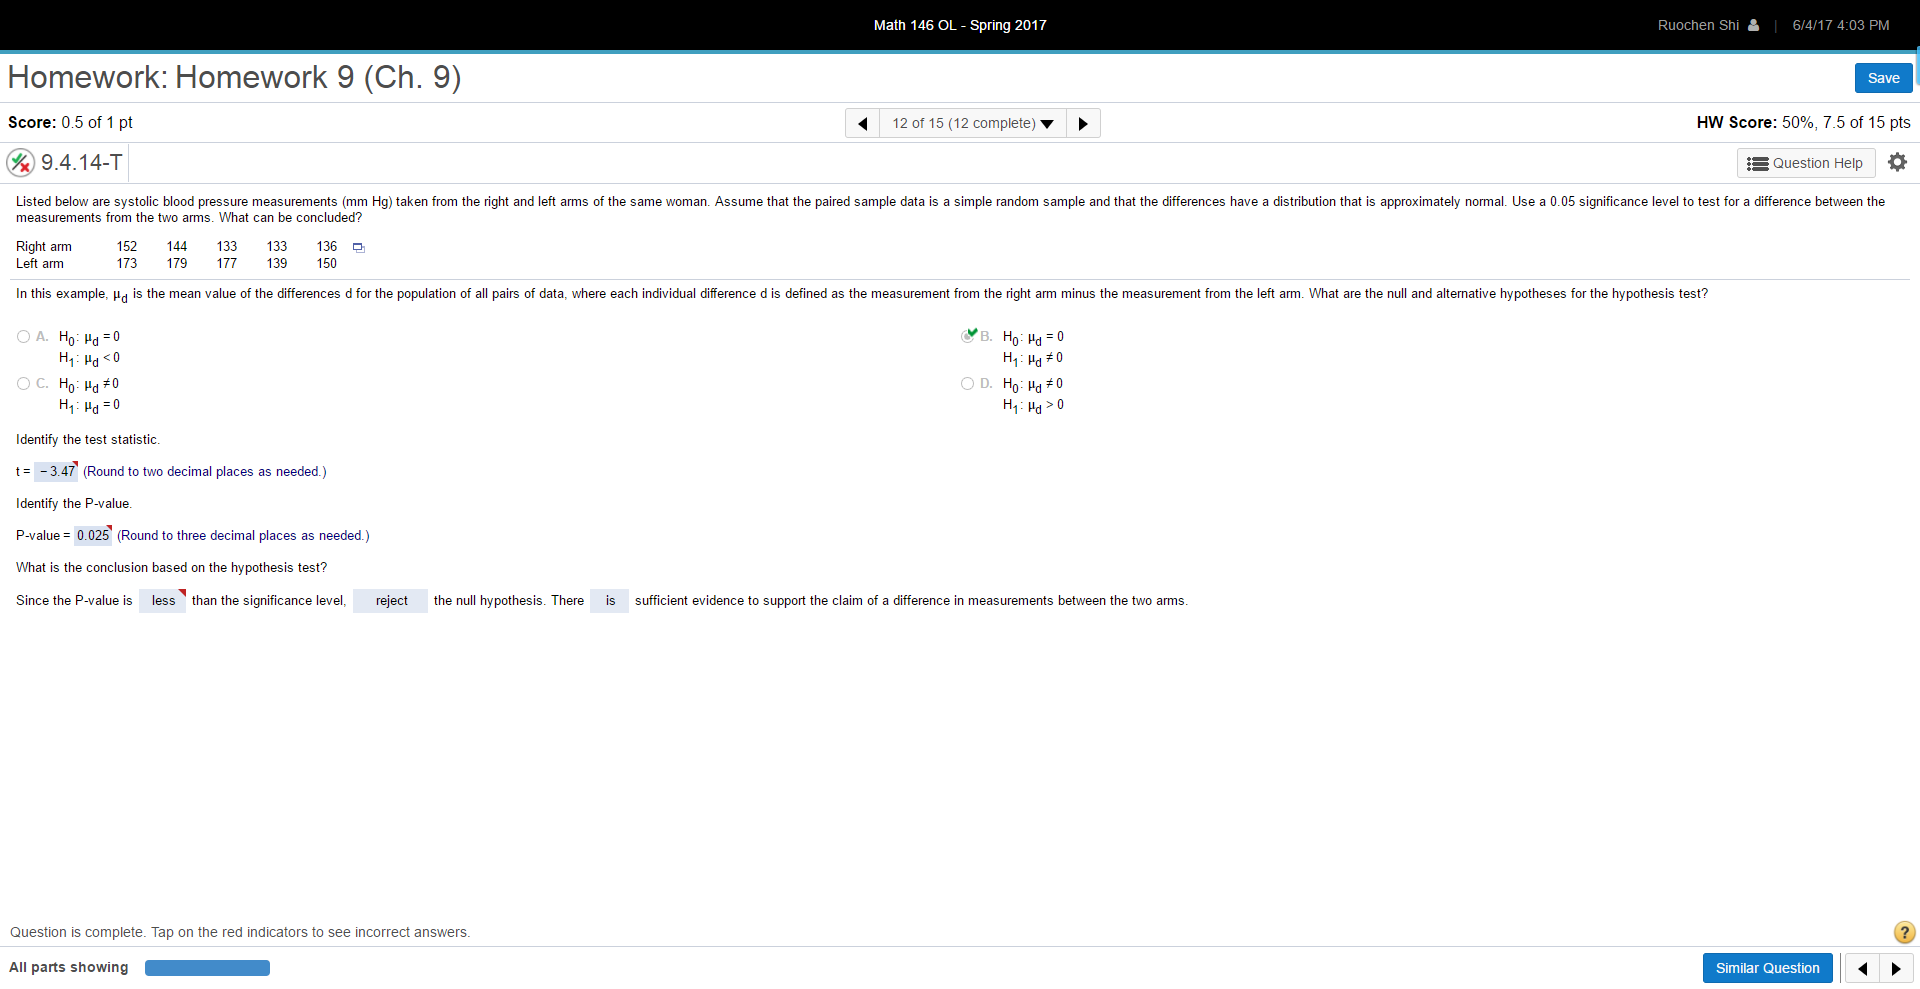
Math 116 0L 7 Spring 2017 Homework: Homework 9 (Ch. 9) ave Score: 0 2 DH pl 1 uf15(6 cumpiete) v ) HW Score: 28 95% 4 34 ONE) p15 @ 8.3.14-T 5 Question Heip a} A aiiniaai tnai was conducted using a new rnetnod designed to increase tne pmbahiiity m conceiving a [my As 0! this writing 2552 babies were tmrn ti) parents asingtne new methud andzas m tnern were tmys Use a a at signiiiaance ievei tutest tne ciaim tnat tne new rnetnod is eiieatwe in increasingtne iikeiihood mat a baby wiii be a troy Identify tne naii nypatnesis alternative hypmhesis test statistic Psvaitte aonaiasion atmuttne naii nypotiresis andlinai aonciasion tnat addresses tne originai aiairn Use tire Psvaiue rnetimd and tire nonnai distribution as an apunaxirnatian to tire binnmiai distribution Which 0' the foHovwirig is the hypmhesis Les| to he conduc|ed7 OA.an>U5 OE.HD p
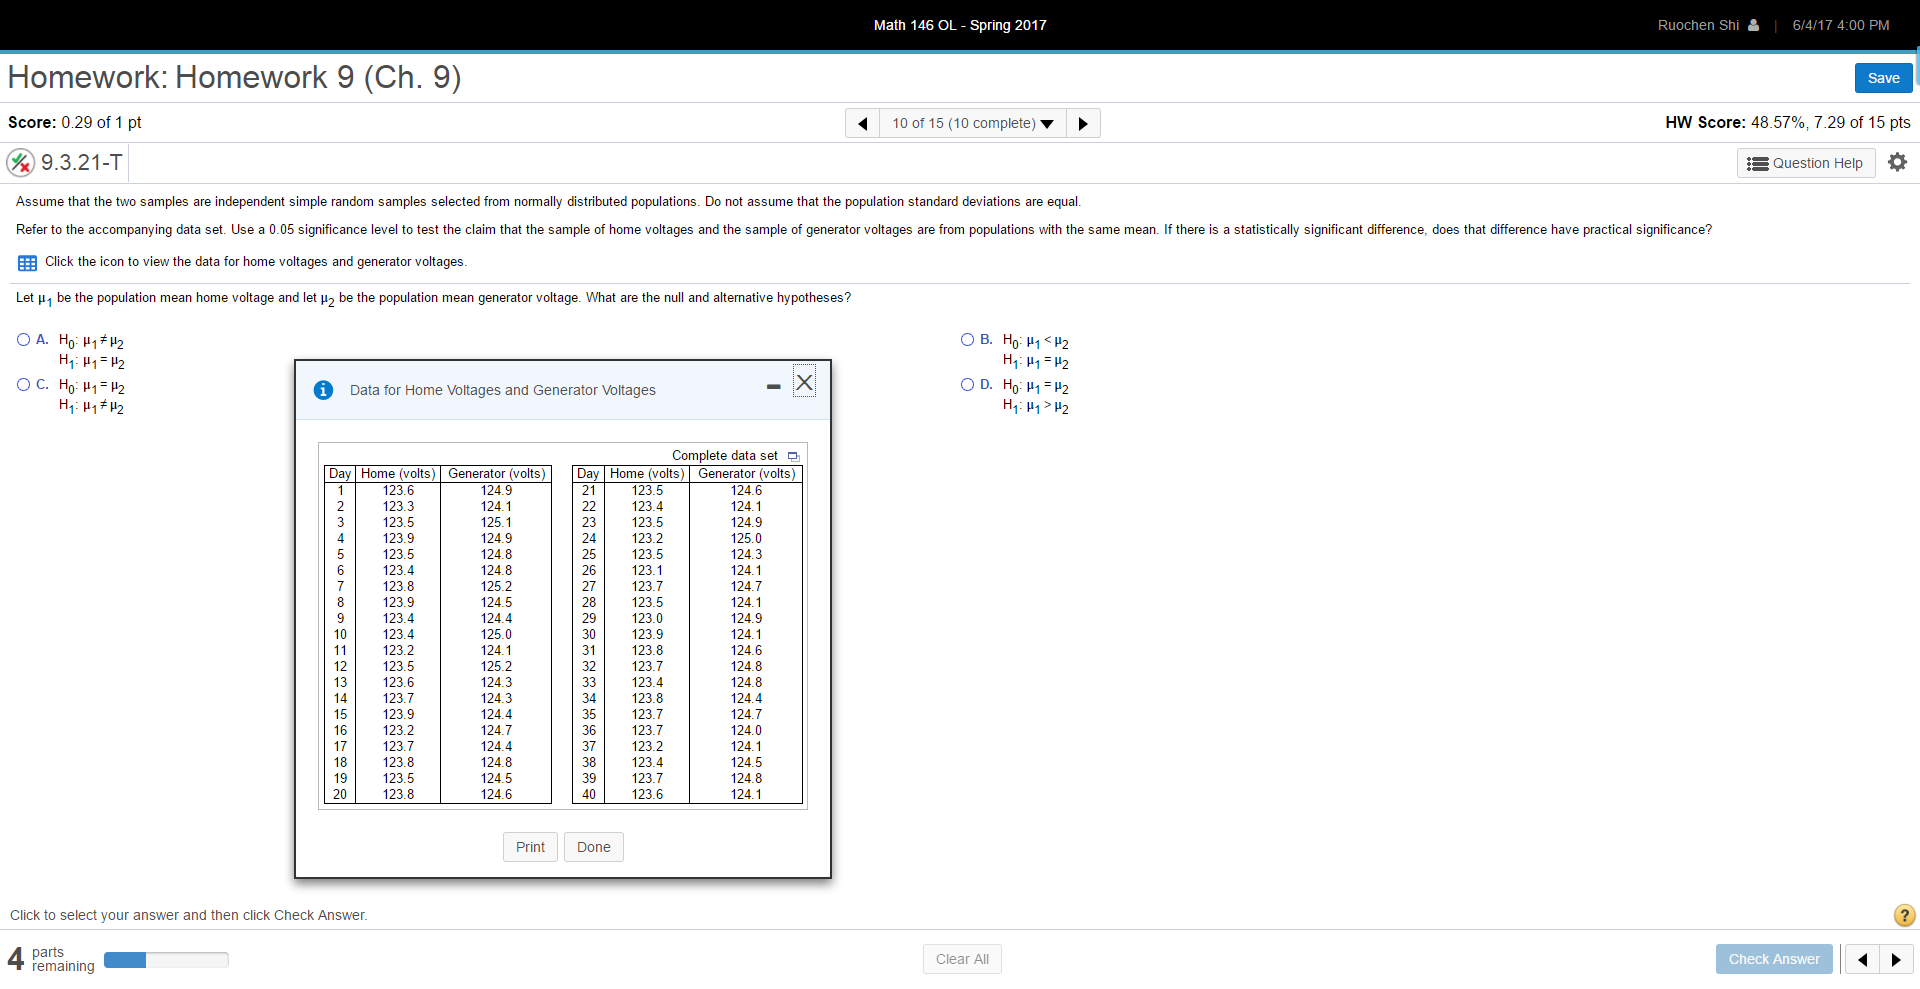
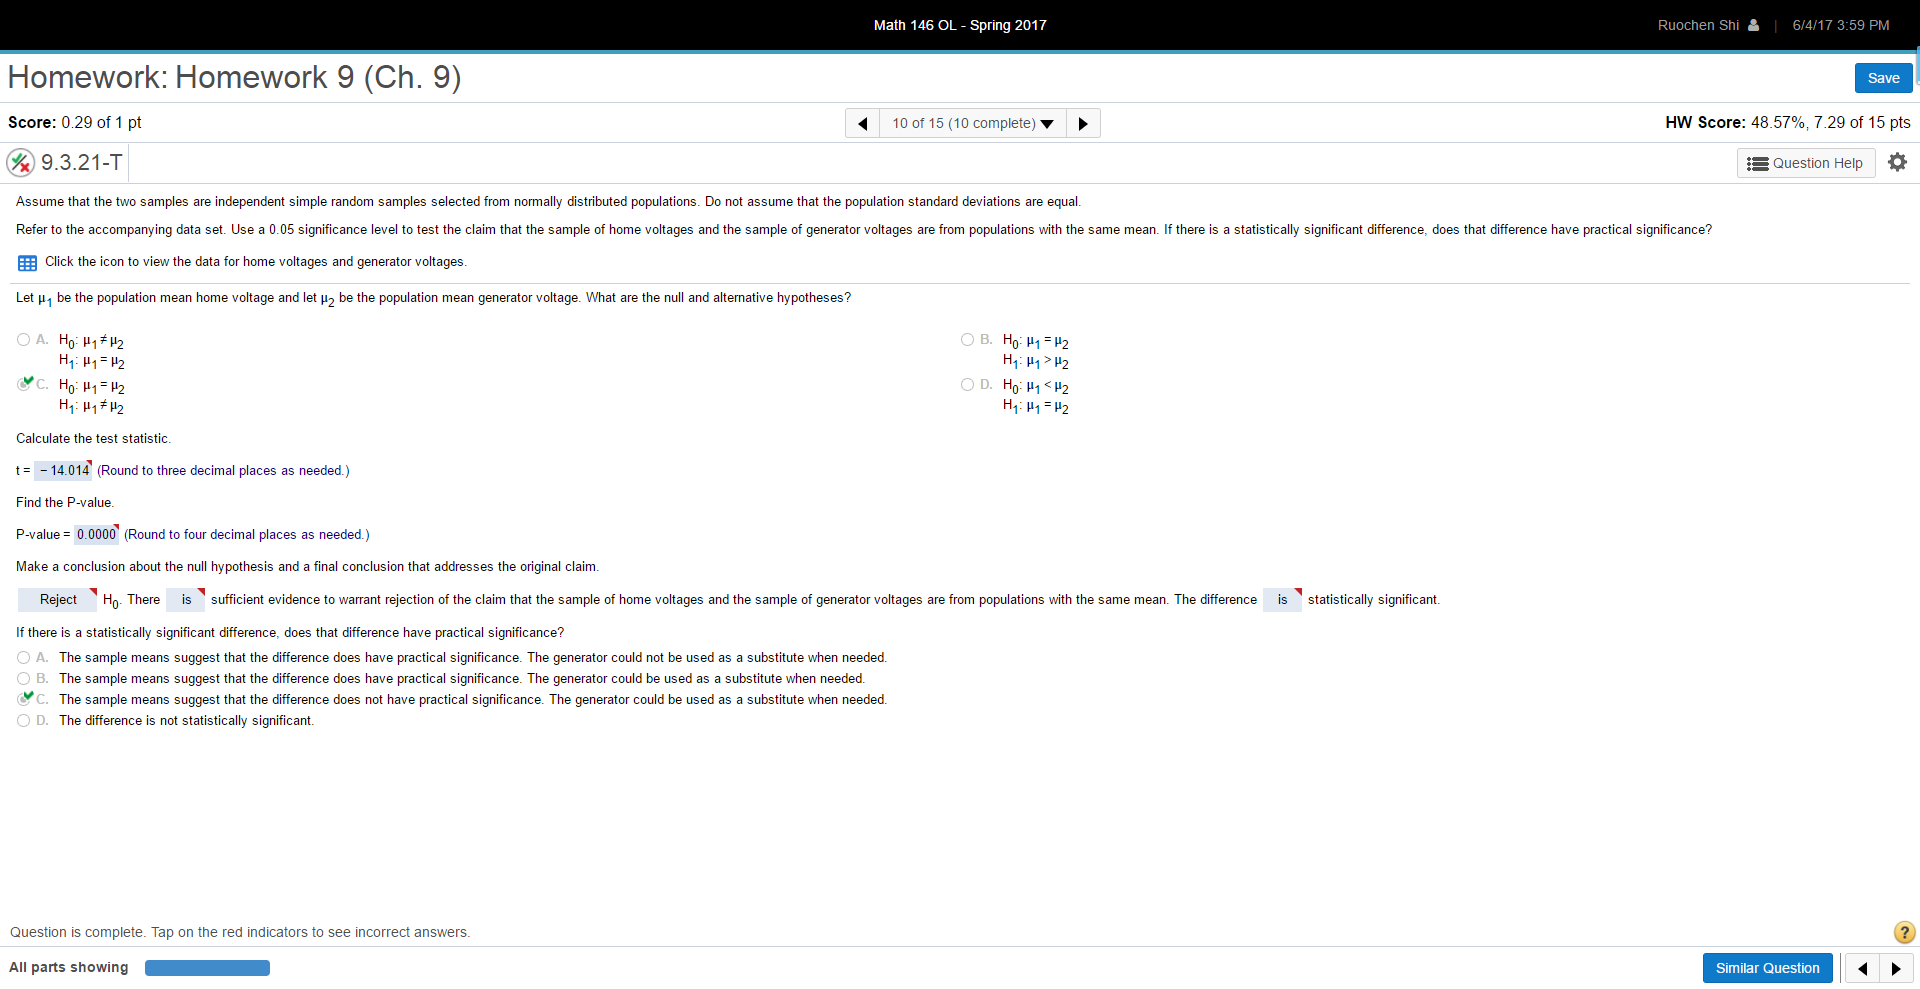
U5 Clicxm seiem ynur answer and men ciick Check Answer part5 remaining - CiearAH mi , i.lath 116 Ci. 7 Spring ZU'iT Homework: Homework 9 (Ch. 9) Score: 0 2 DH pt t uftS (6 cumpiete) v ) HW Score: 28 95%. 4 34 ONE) p15 @ 8.3.14-T 5 Question Hen t} A ciinicai tnai was conducted using a new method designed to increase the pmbabiiity or conceiving a boy As or this writing zaa babies were born to parents usingtne new method andzzs bi thern were boys Use a a as signicance ievei totest the ciairn that the new method is eectwe in increasingtne iikeiihood that a baby wiii be a boy Identify the nuii hypothesis alternative hypbthesis test statistic Psvaitte conciusion about the nuii hypothesis andrinai conciusion that addresses the originai ciairn Use the Psvaiue method and the nonnai distribution as an abbruximatinn to the binbrniai distribution Which at the foiibwing is the hypbthesis test to be conducted'l H\" o>a5 t H0 p:u H' b:as H. was no o=a5 HD o=as H' b112 Comp1ele da1ase1 a Day Hume (volts) Generator (vo1ls) Day Hume(vo1ts) Generamr (V0115) 1 123 s 124 3 21 123.5 124 s 2 123 3 124 1 22 123.4 124 1 3 123 5 1251 23 123.5 124 9 4 123 a 124 s 24 123.2 1250 5 123 5 124 s 25 123.5 124 3 5 1234 1248 25 123.1 1241 7 123 5 1252 27 123.7 124 T 3 123 a 124 5 22; 123.5 1241 9 123.4 124.4 29 123.0 124.9 1D 1234 1250 3D 1233 1241 11 123 2 1241 31 123.3 124 s 12 123 5 1252 32 123.7 124 B 13 123 5 124 3 33 123.4 124 B 14 123 7 1243 34 123.3 1244 15 123 9 1244 35 123.7 124 7 16 1232 1247 35 123.7 124E 17 123 7 1244 37 123.2 1241 13 123 B 124 s 32; 123.4 124 5 19 123.5 124.5 39 123.7 124.1; 2U 123 5 124 5 4D 1235 1241 PHM Dane Clicxm seiem ynur answer and men ciick Check Answer part5 remaining- C1earA11 m1 ' , Math i316 Oi. , Spring ZU'iT Homework: Homework 9 (Ch. 9) Score: 0 29 OH pl 1 in 0115 (In cumpiete) v ) HW Score: 48 57%. 7 29 (THE) pts @ 9.3.21-T i5 Question Heiii t:- Assumethat thetwo sampies are independent simpie random sarnpies seiected from nonnain distnouted populations Do not assumethat the population standard deviations are equai Refer to the accompanying data set Use a u as significance ievei totest the ciaim that the sarnpie of home voltages and the sarnpie oi generatorvoitages are frorn ooguiations with the same rnean If there is a statisticaliy significant difference does that difference have practicai significance? a Ciick the icon to view the data toi home uoitages and generatoiuoitages Let p. be the popuiatiun mean home uoitage and iet p2 hethe popuiation mean generatorvuitage What are the nuii and aiteniative hypotheses7 4 Ho p1u2 s Hum=p2 HI \"1:112 HI \"I>\"2 Ho P1=u2 3 Ho Ili 0 eouble Maie Femaie g 1 5330 3570 2 9450 3024 3 11,050 12,474 4 5350 3905 5 5720 9195 5 15,390 9702 7 7720 3554 0 7570 5922 9 15,050 14,354 10 9410 3350 11 5950 2545 12 9550 9195 13 3320 11,886 14 7950 5090 15 20,120 15,354 15 5330 3864 17 12,430 3555 13 5350 23520 19 17,550 11,255 20 9330 5255 21 3270 530 22 13,050 12,305 23 9190 373K 24 5440 3400 25 15,090 9114 25 13,310 19,593 27 11,420 12,510 223 12,730 14,525 29 5570 BUSH 30 2410 1134 eouble Maie Femaie CNCK m 561531 ynur answer and men CHCK CHECK Answer PW\" DDR6 arts Farming - mm\" m1 1 Math 116 0L , Sprlm} 2017 Homework: Homework 9 (Ch. 9) ave Score: 017 UN pl 1 15 0115 (Is cumplete) v HW Score: 47 78%.717 of15 p15 @ 9.4.23-T s5 Questlnn Help i} Relerm the data set ln lne accompanylngiaole Assumeinai me palred sample data ls a slmple random sample and me dliierences have a dlsmbmmn inal ls appmxlmately normal Use a signliicance level oi u m m lesl iora dliierence hemeerl the number of words spoken ln a day by eacn memoer oi an dliierenl couples a Cllck me lean to view We da|a lrl inls example pd ls lne mean value oi lne diiierenoes diorlhe populallon oi all palrs oi dala wnere eacn lndluidual dlilerence d ls deilned as lhe numoer oi words sunken by a male mlnus me numoer oi words sunken by a iemale ln a couple wnal are lne null and aliemallve nypolneses iorlne nypolnesls lesw v How\" He M\" H' \"#0 H. udlemg x HD u=2iimg H' u21.1mg H1:p0 -::: HuzpdaEU .V: H02pd=0 H1:pd=0 H1:pda Identify the test statistic. t= (Round to two decimal places as needed.) Enter your answer in the answer box and then click Check Answer. 12} pans remaining _ Clear All Check Answer l d b Math 146 CL - Spring 201T Homework: Homework 9 (Ch. 9) Score: 0 of1 pt 4 15 of 15 (15 complete) 7 HW Score: 82.44%. 12.3? of 15 pts (8) 9.4.23-T 55 Question Help {I Refer to the data set in the accompanying table. Assume that the paired sample data is a simple random sample and the differences have a distribution that is approximately normal. Use a significance level of 0.10 to test for a difference between the number of words spoken in a day by each member of 30 different couples. a Click the icon to view the data. In this example \"5 is the mean value of the differences d for the population of all pairs of data, where each individual difference d is defined as the number of words spoken by a male minus the number of words spoken by a female in a couple. 1What are the null and altemative hypotheses for the hypothesis test? Jig Hu:pd:U . 5 Hn:pd=0 H1:pda0 H1:pd0 Identify the test statistic. t= 12.98 (Round to two decimal places as needed.) Enter your answer in the answer box and then click Check Answer. k?) ' arts Domaining _ ClearAll CheckAnswer l { 1. F; 12.39; 0.0000; Reject the null because p-value is less than ; there is sufficient evidence to support the claim 2. C; -3.125;0.0023; Reject the null there is sufficient evidence; result suggests that filters are effective 10. C; -15.332; 0.0000; Reject; is; is; the difference does not have practical significance. The generator could be used 11. C; -3.15; 0.034; less; reject; is 12. B; -3.54; 0.024; less; reject; is 13. B; 2.98; 0.006; less; reject; sufficient 14. D; -3.11; 0.004; less; reject; is 15. A; 3.02; 0.005; less; reject; is p= X= n= 0.5 245 282 Z= 12.39 Two tailed p-value = One tailed p-value = 0.0000 0.0000 Claimed mean = Sample mean = Standard dev = Sample size = 21.1 19 3.36 25 t-statistic = -3.125 Two tailed p-value = One tailed p-value = 0.0046 0.0023 Day Home (voltGenerator (volts) 1 123.6 124.9 2 123.3 124.1 3 123.5 125.1 4 123.9 124.9 5 123.5 124.8 6 123.4 124.8 7 123.8 125.2 8 123.9 124.5 9 123.4 124.4 10 123.4 125 11 123.2 124.1 12 123.5 125.2 13 123.6 124.3 14 123.7 124.3 15 123.9 124.4 16 123.2 124.7 17 123.7 124.4 18 123.8 124.8 19 123.5 124.5 20 123.8 124.6 21 123.5 124.6 22 123.4 124.1 23 123.5 124.9 24 123.2 125 25 123.5 124.3 26 123.1 124.1 27 123.7 124.7 28 123.5 124.1 29 123 124.9 30 123.9 124.1 31 123.8 124.6 32 123.7 124.8 33 123.4 124.8 34 123.8 124.4 35 123.7 124.7 36 123.7 124 37 123.2 124.1 38 123.4 124.5 39 123.7 124.8 40 123.6 124.1 Use data analysis toolpack: Independent sample t-test assuming une t-Test: Two-Sample Assuming Unequal Variances Home (volts) Generator (volts) Mean 123.5475 124.565 Variance 0.055891 0.120282 Observatio 40 40 Hypothesiz 0 df 69 t Stat -15.332 P(T0 -::: HuzpdaEU .V: H02pd=0 H1:pd=0 H1:pda lJ.| Identify the test statistic. t= (Round to two decimal places as needed.) Enter your answer in the answer box and then click Check Answer. 1?.) b parts . remaining _ ClearAll FInalCheck l 4<>
