

Question
(8) Suppose the number of patients participating in a study is n(which is the number of trials), and the number of patients who response to
(8) Suppose the number of patients participating in a study is "n"(which is the number of trials), and the number of patients who response to the therapy is "X" (which is the number of successes), the sample proportion =
(9)If the sample proportion is nearly normally distributed, ________________approximation to Binomial can be used to conduct the inference.
(10) __________________ inference based on the Binomial Distribution is used when X does not havean approximately normal distribution.
(11)What are the two conditions for the sampling distribution of being nearly normal?
(12) If the two conditions are met, then the sampling distribution of is approximately normal with mean p and standard error determined by what formula?(note: standard error is another name for the standard deviation of the sampling distribution of)
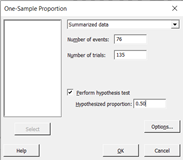
Confidence Interval for Proportions with Minitab:
(13) Construct a 95% confidence interval if is 0.48 and the sample size is 250.
(Note, = X, so, if we multiply by n on both sides, we get X= n*, n represents the number of trials and X represents the number of successes or the events)
we will use Minitab for this)
Step 1, calculate n*and n**(1-)
Step 2. Check to see if the success failure condition is satisfied, i.e. are the values of n*and n**(1-)? 10?
(In Minitab, use the Normal approximation method if both n*, and n**(1-) are ? 10, if not use the Exact Method)
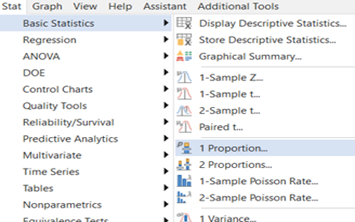
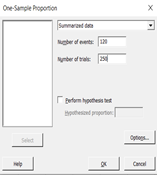
Step 3. Minitab> Stat>Basic Statistics> 1 Proportion> Summarized Data> No. of events (in this case it is n*= 120)>No. of trials
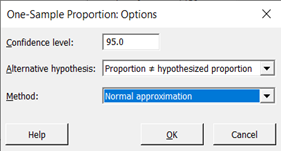
>250>Options>Confidence Interval 95%> Method>Normal approximation>OK>OK

Step by Step Solution
There are 3 Steps involved in it
Step: 1

Get Instant Access to Expert-Tailored Solutions
See step-by-step solutions with expert insights and AI powered tools for academic success
Step: 2

Step: 3
Ace Your Homework with AI
Get the answers you need in no time with our AI-driven, step-by-step assistance
Get Started
Intermediate Algebra
Authors: Marvin L Bittinger
11th Edition
0321968395, 9780321968395