

Answered step by step
Verified Expert Solution
Question
1 Approved Answer
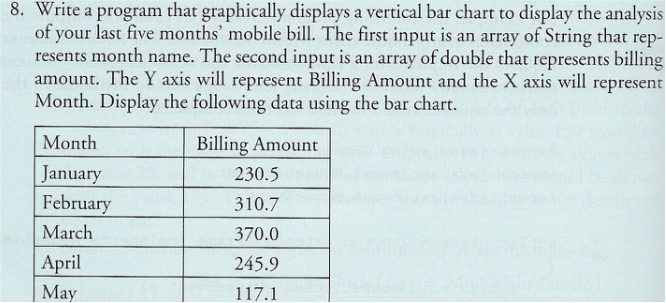
8. Write a program that graphically displays a vertical bar chart to display the analysis of your last five months' mobile bill. The first input
Step by Step Solution
There are 3 Steps involved in it
Step: 1

Get Instant Access to Expert-Tailored Solutions
See step-by-step solutions with expert insights and AI powered tools for academic success
Step: 2

Step: 3
Ace Your Homework with AI
Get the answers you need in no time with our AI-driven, step-by-step assistance
Get Started
Accounting And Auditing Research And Databases Practitioner's Desk Reference
Authors: Thomas R. Weirich, Natalie Tatiana Churyk, Thomas C. Pearson
1st Edition
1118334426, 978-1118334423