Question
8-1. Hytek Corporation ended 2012 with cash of $50,000, accounts receivable of $100,000, and inventory of $300,000. Property, plant, and equipment were valued at their

8-1. Hytek Corporation ended 2012 with cash of $50,000, accounts receivable of $100,000, and
inventory of $300,000. Property, plant, and equipment were valued at their original cost of
$470,000, less accumulated depreciation of $170,000. Current liabilities other than income
taxes owed (see details that follow) were $120,000, and long-term debt was $250,000.
Stockholders equity consisted of (a) $90,000 capital stock investment and (b) accumulated
retained earnings, which had totaled $130,000 at the end of 2011. Net sales for 2012
were $900,000. Expenses included $500,000 as cost of goods sold, $50,000 as allowance
for depreciation, $85,000 as selling expense, and $65,000 as G&A expense. Interest income
and expense were $5,000 and $25,000, respectively, and income taxes for the year (unpaid at
years end) were $80,000. Dividends of $20,000 were paid. Prepare a balance sheet and an
income statement reflecting these figures.
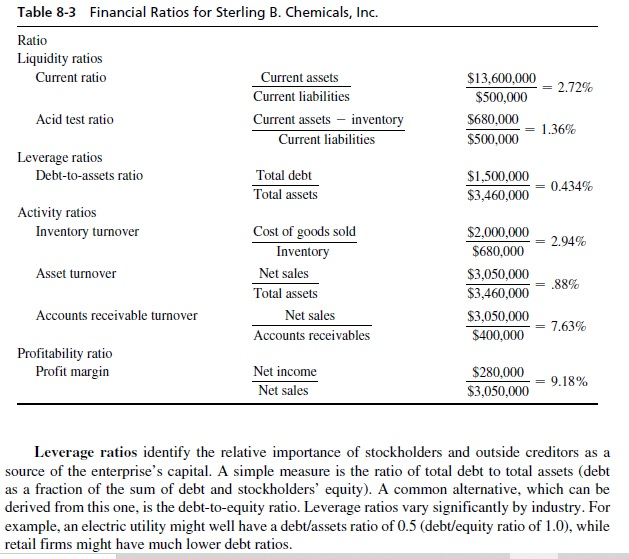
8-2. Use the output of Question 8-1 to calculate the current ratio, acid test ratio, leverage ratio,
and profit margin of Table 8-3. Comment on the values you obtain.
Table 8-3 Financial Ratios for Sterling B. Chemicals, Inc. Ratio Liquidity ratios Current ratio $13,600,000 -2.72% Current assets Current liabilities Current assets inventory Current liabilities Acid test ratio $500,000 $680,000 = 1.36% $500,000 Leverage ratios Debt-to-assets ratio Total debt Total assets $1,500,000 $3,460,000 = 0.434% Activity ratios Inventory turnover = 2.94% $2,000,000 $680,000 $3,050,000 Asset turnover Cost of goods sold Inventory Net sales Total assets Net sales Accounts receivables .88% $3,460,000 Accounts receivable turnover $3,050,000 $400,000 = 7.63% Profitability ratio Profit margin Net income Net sales $280,000 $3,050,000 = 9.18% Leverage ratios identify the relative importance of stockholders and outside creditors as a source of the enterprise's capital. A simple measure is the ratio of total debt to total assets (debt as a fraction of the sum of debt and stockholders' equity). A common alternative, which can be derived from this one, is the debt-to-equity ratio. Leverage ratios vary significantly by industry. For example, an electric utility might well have a debt/assets ratio of 0.5 (debt/equity ratio of 1.0), while retail firms might have much lower debt ratiosStep by Step Solution
There are 3 Steps involved in it
Step: 1

Get Instant Access to Expert-Tailored Solutions
See step-by-step solutions with expert insights and AI powered tools for academic success
Step: 2

Step: 3

Ace Your Homework with AI
Get the answers you need in no time with our AI-driven, step-by-step assistance
Get Started


