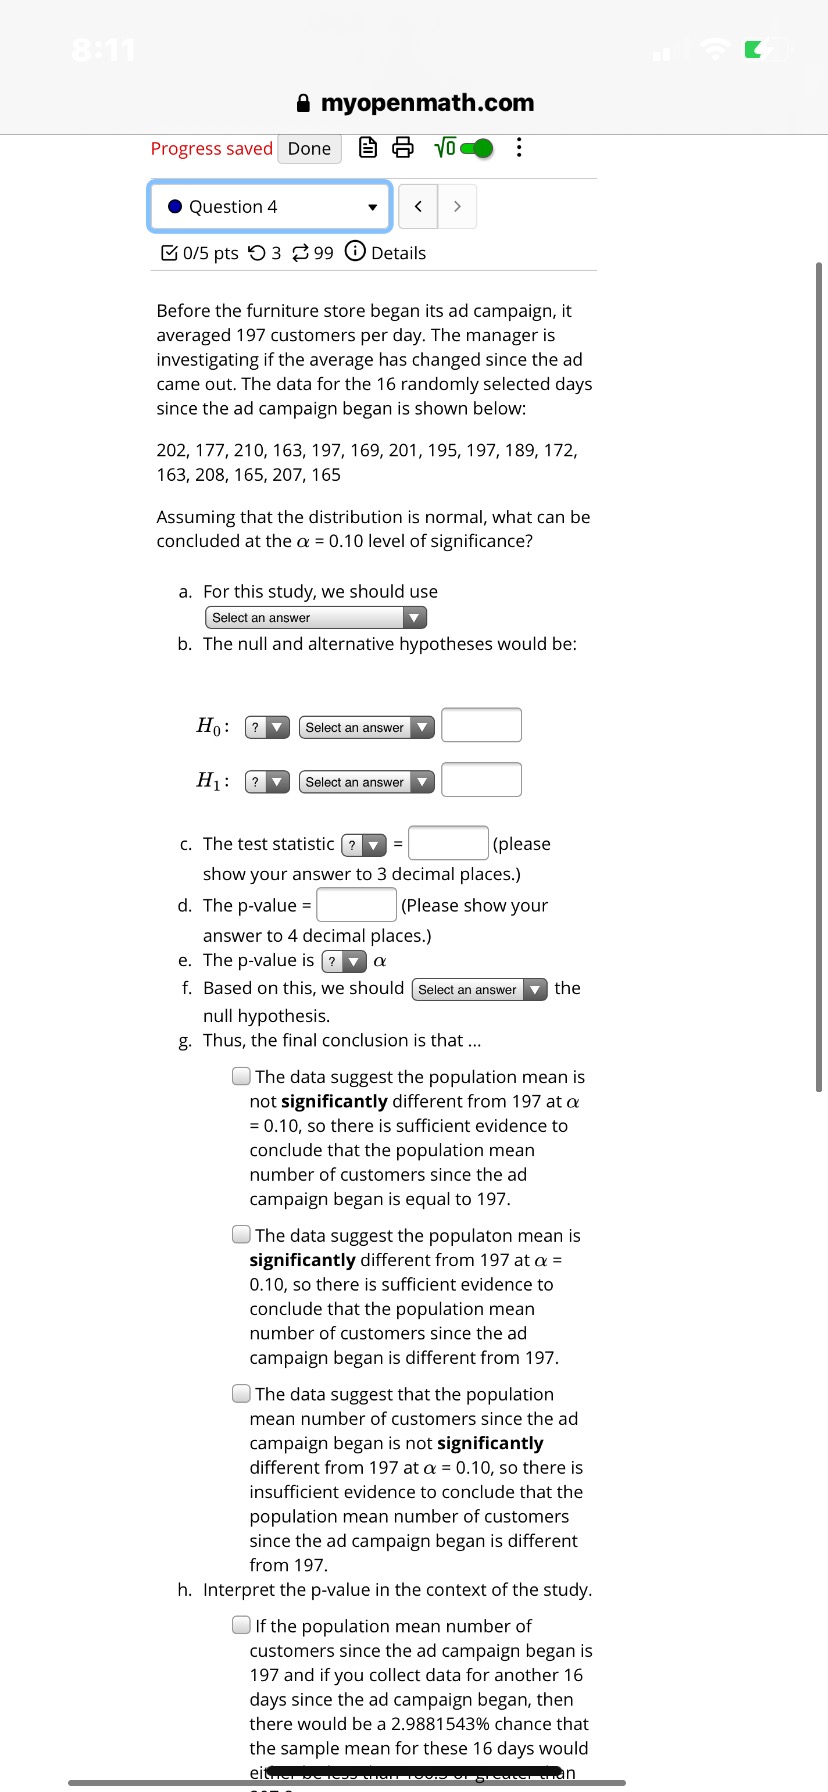
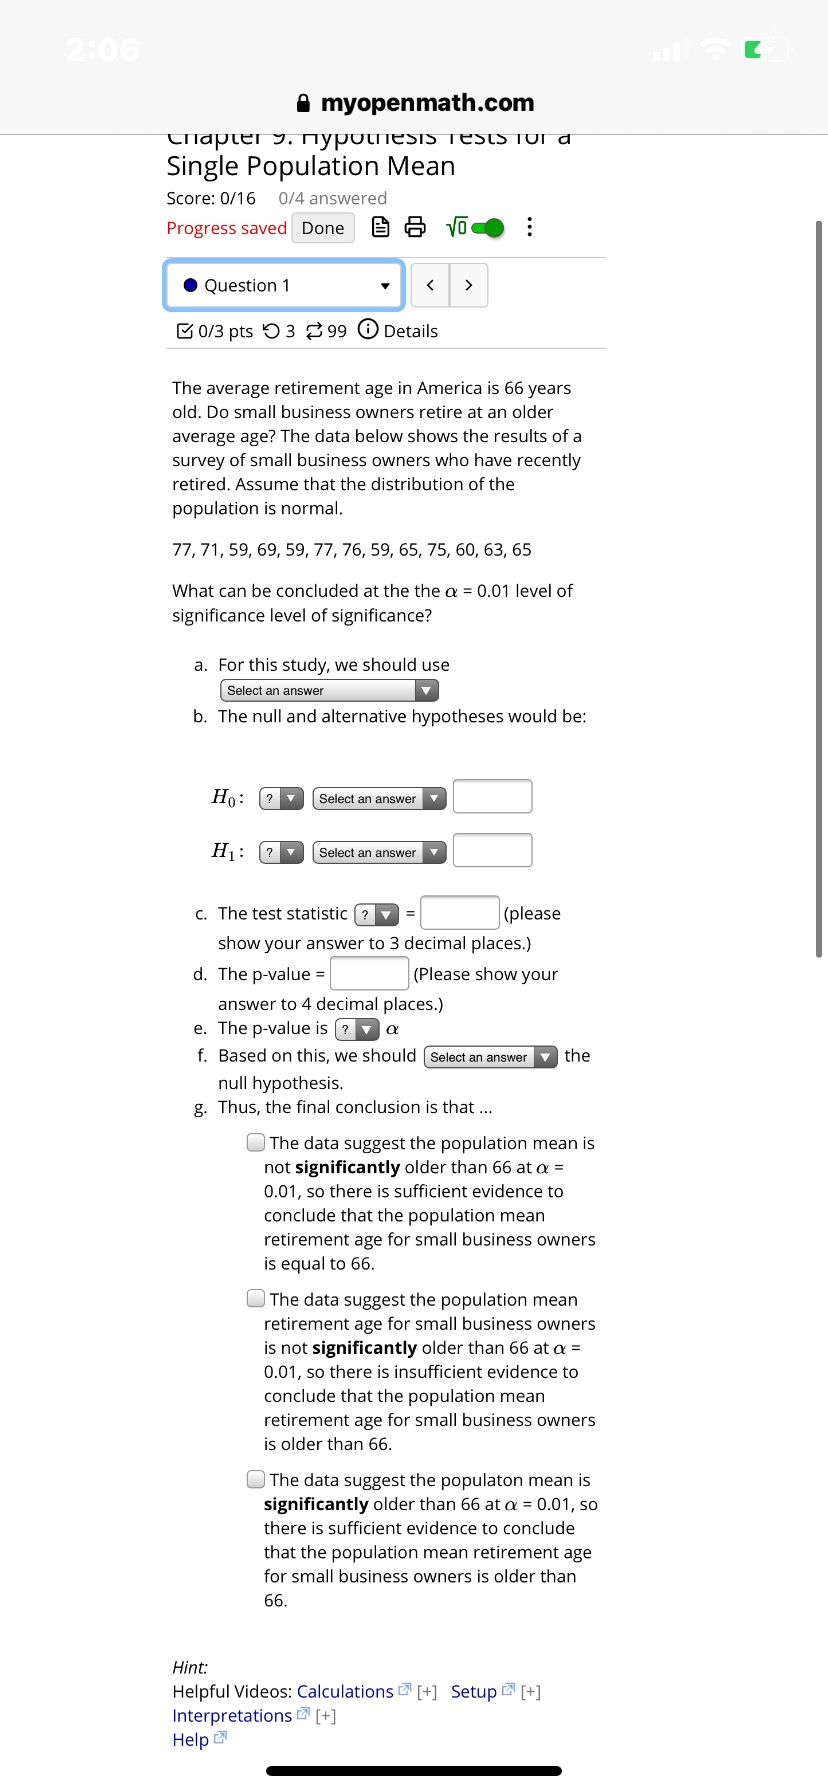
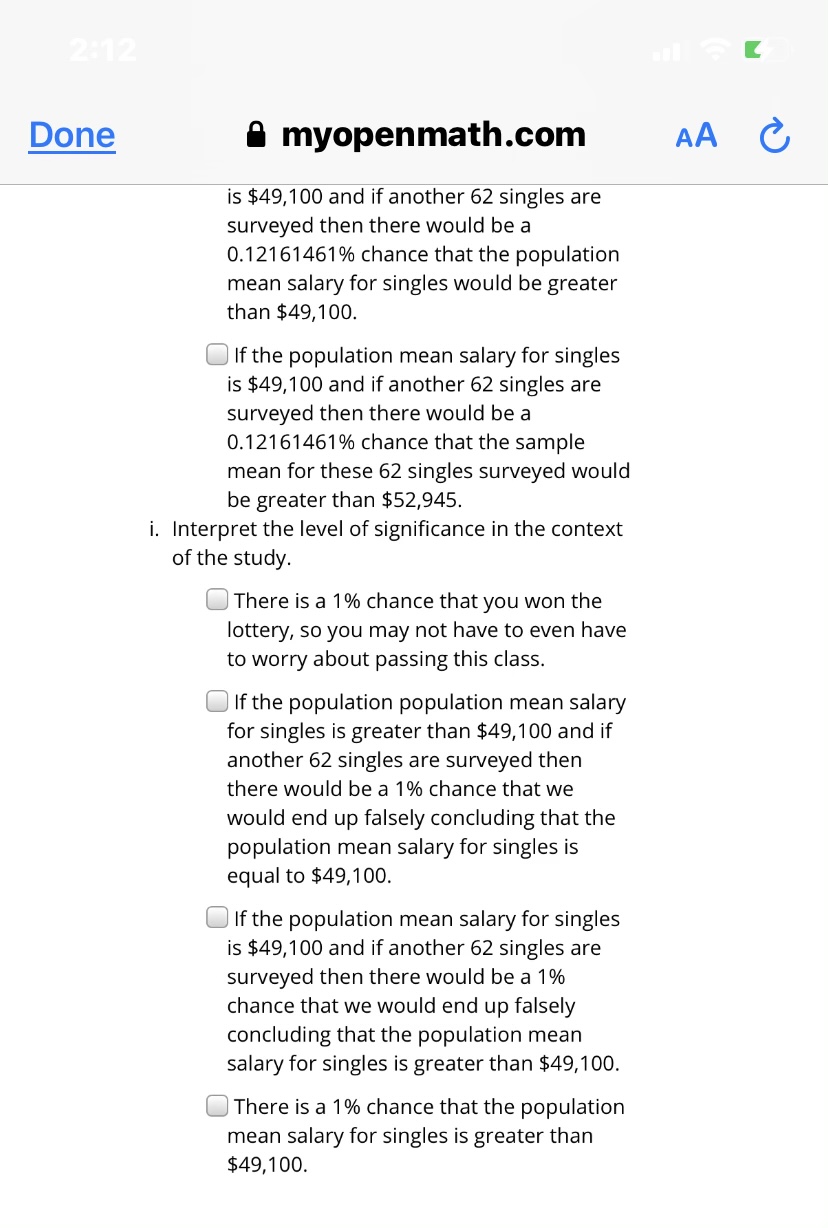
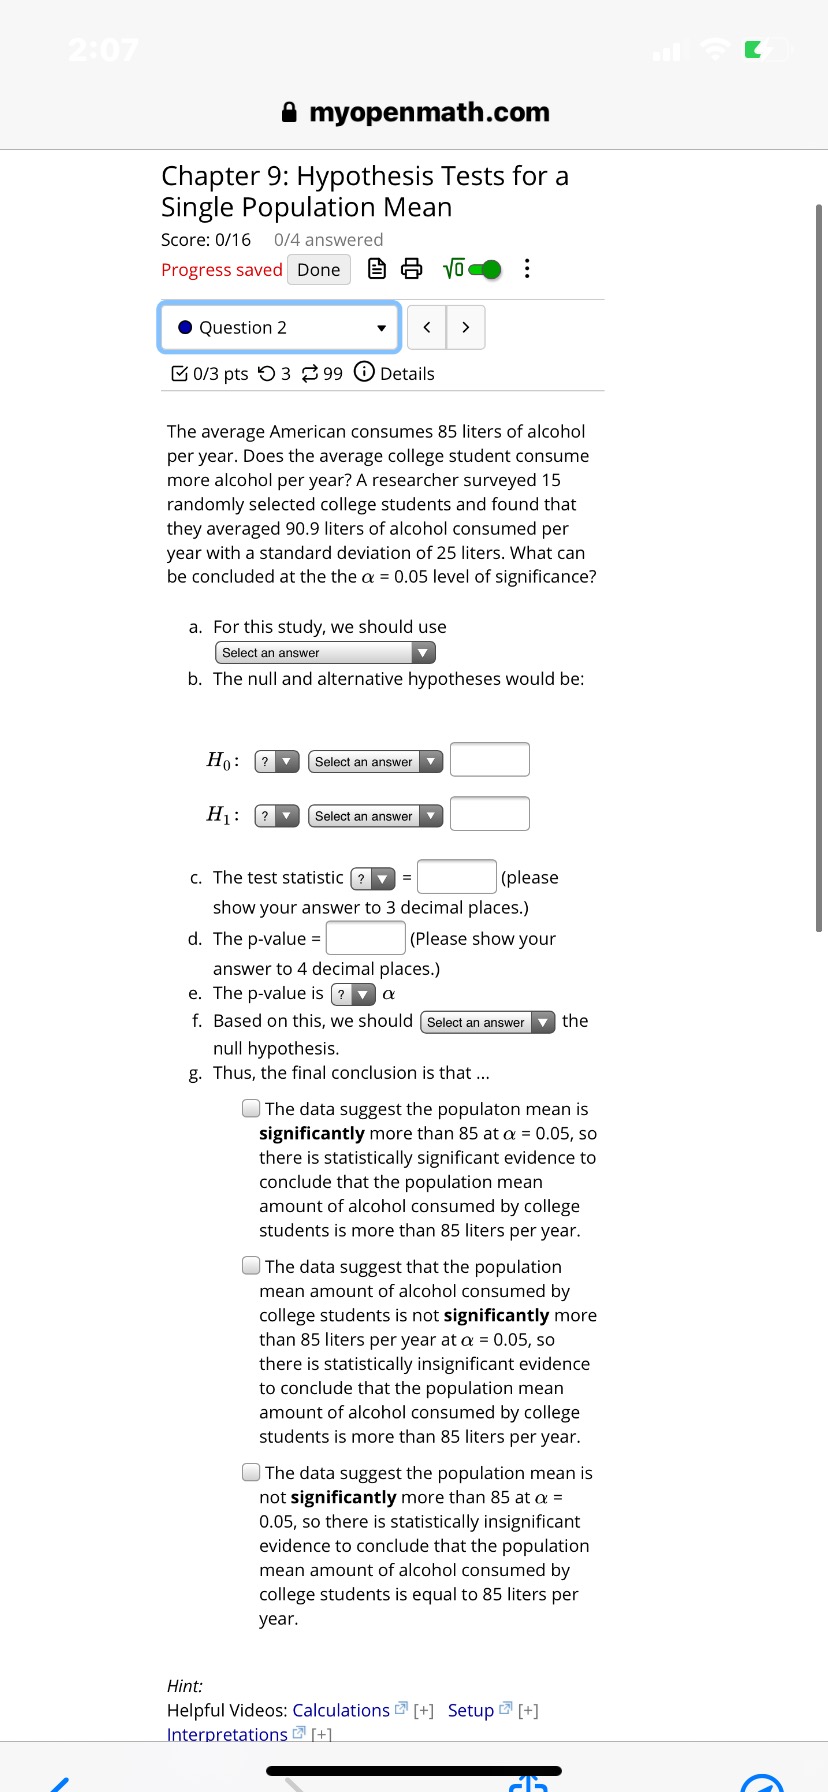
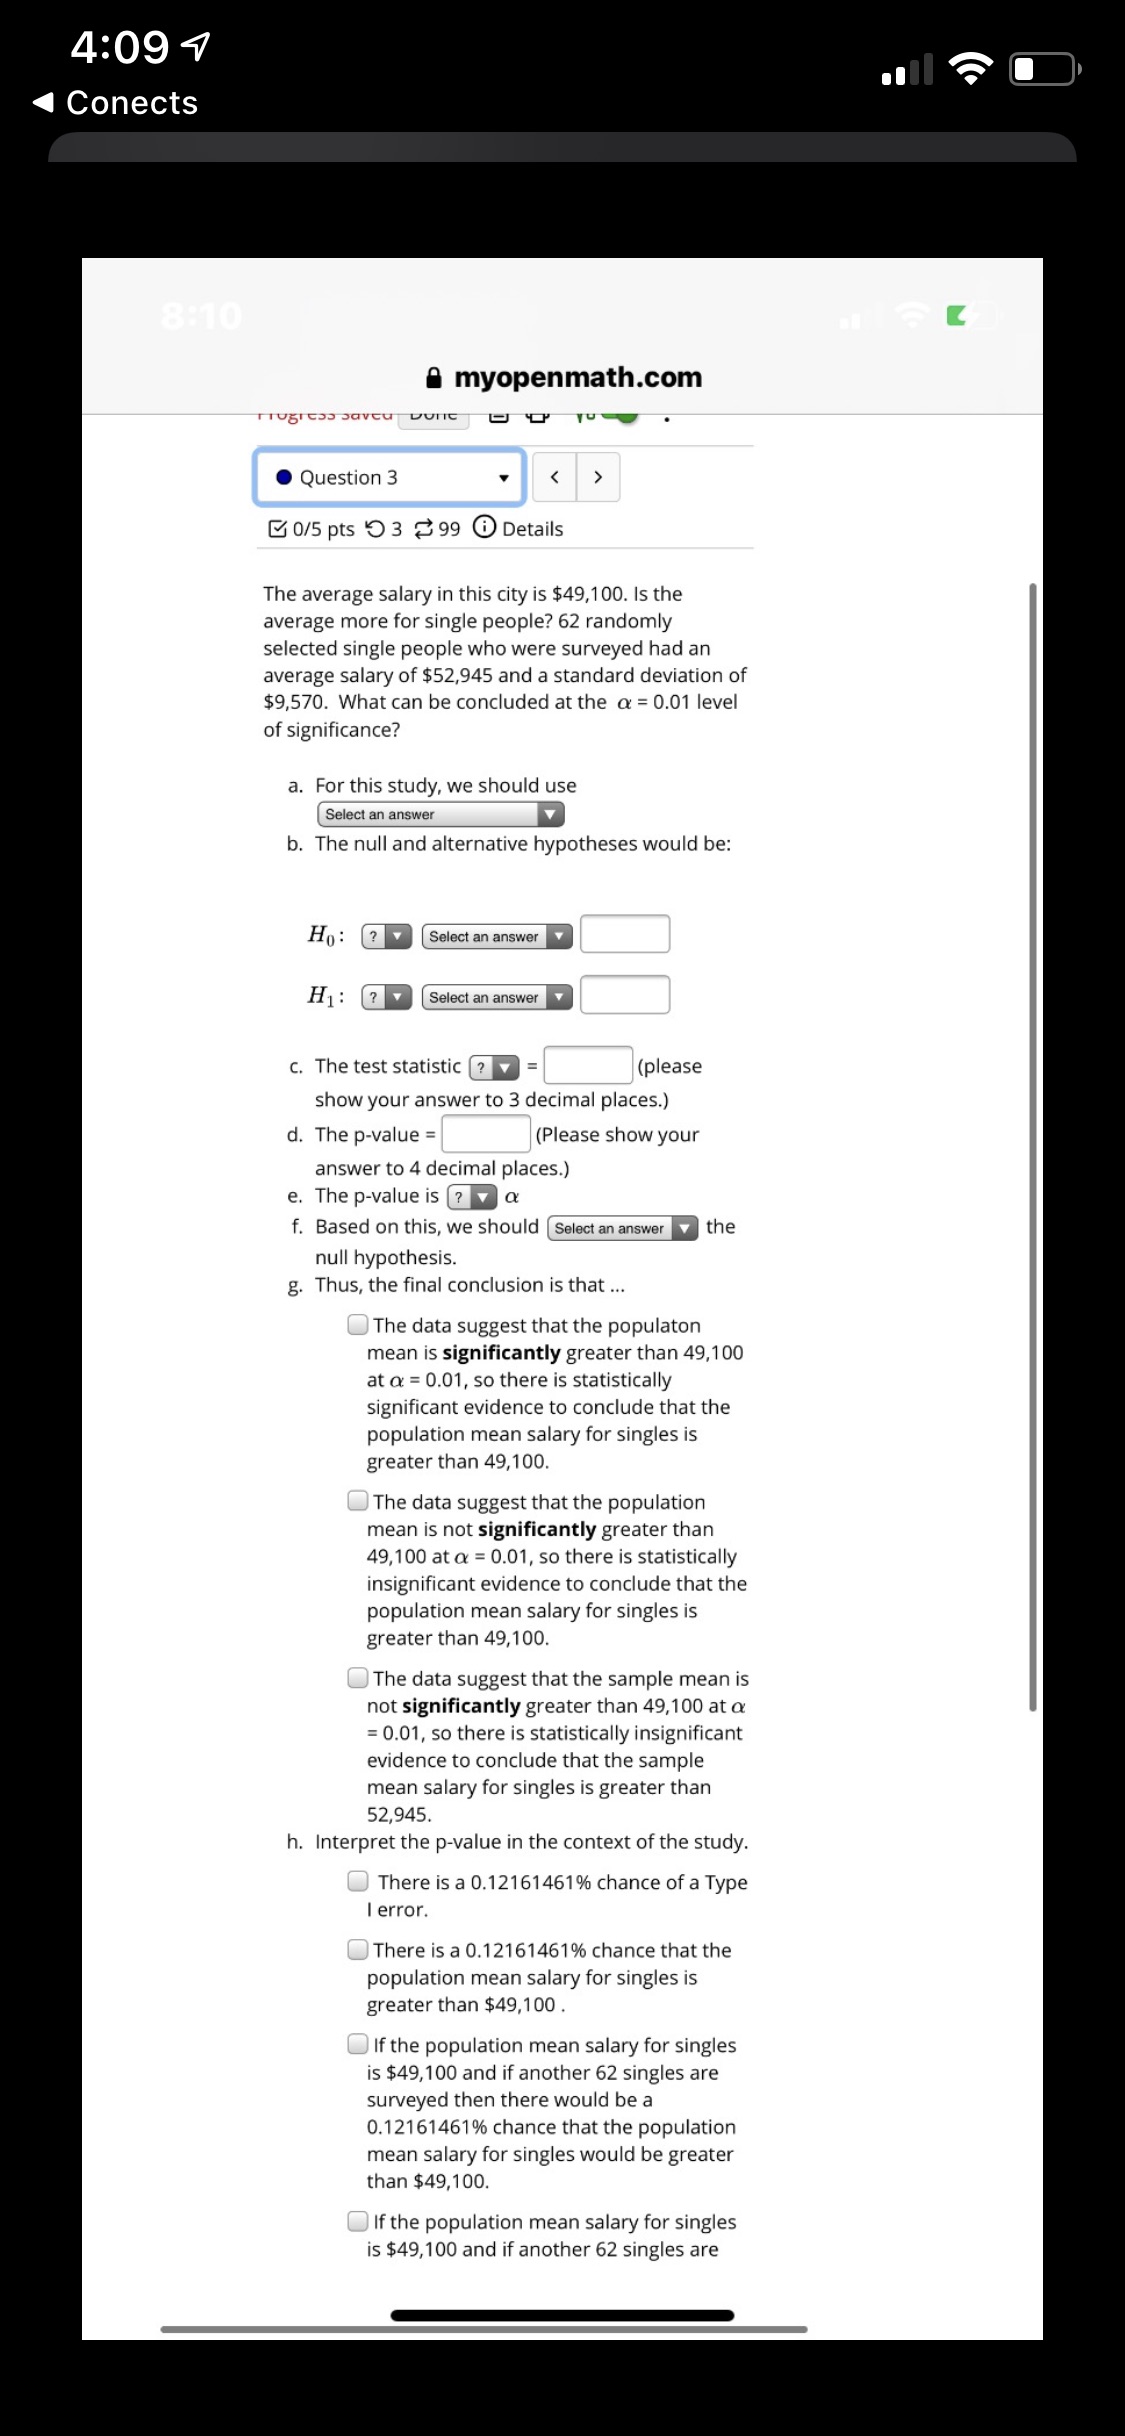
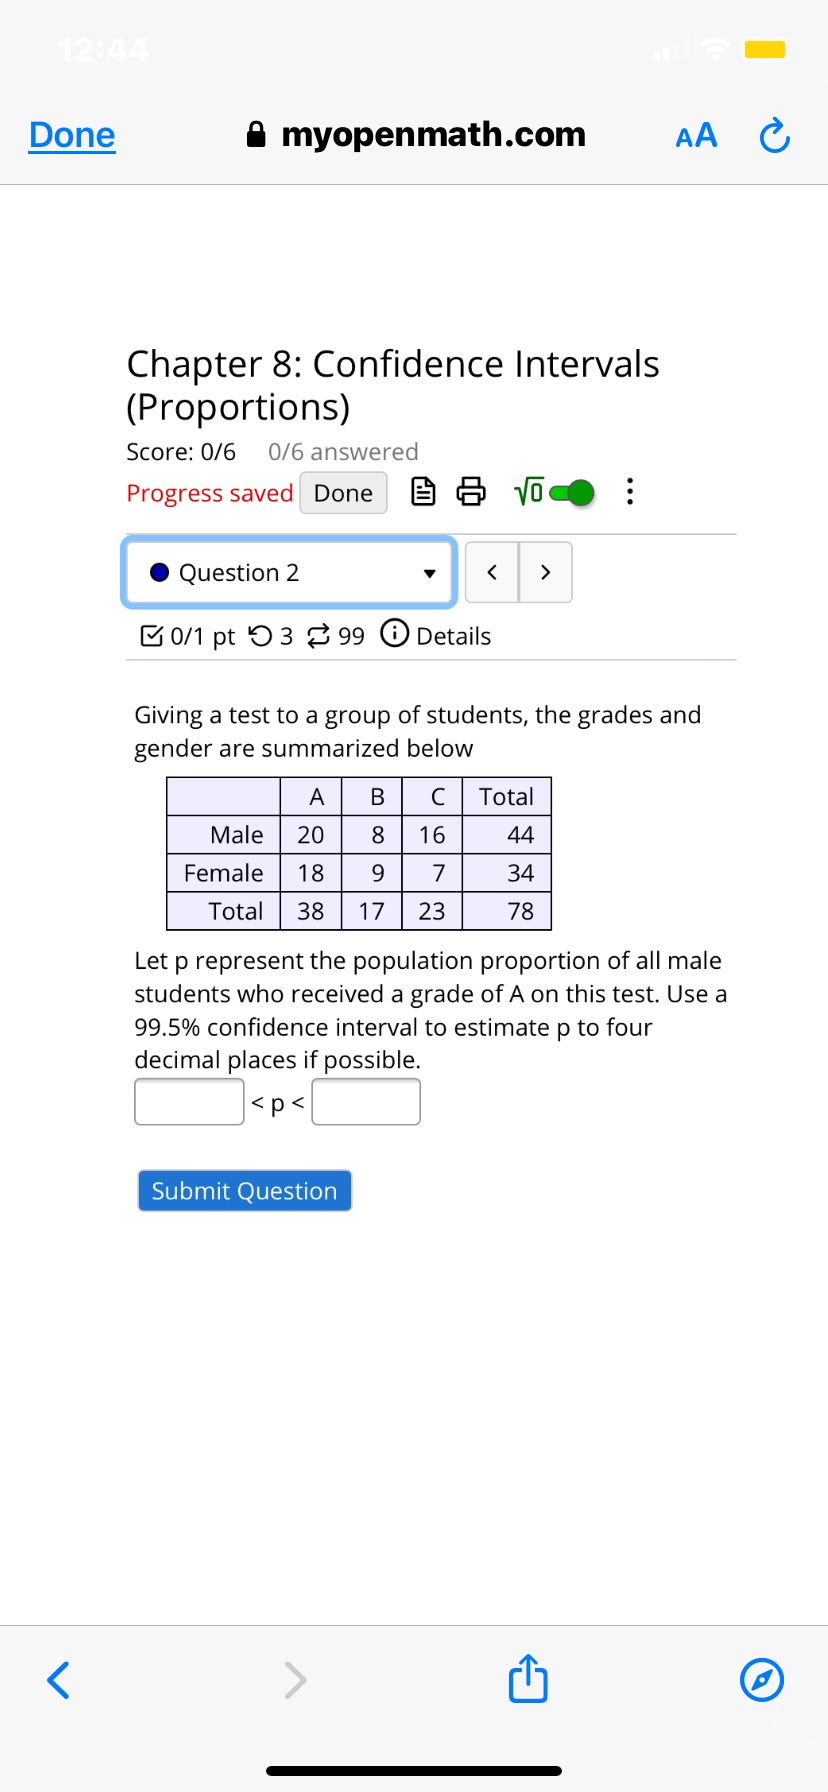
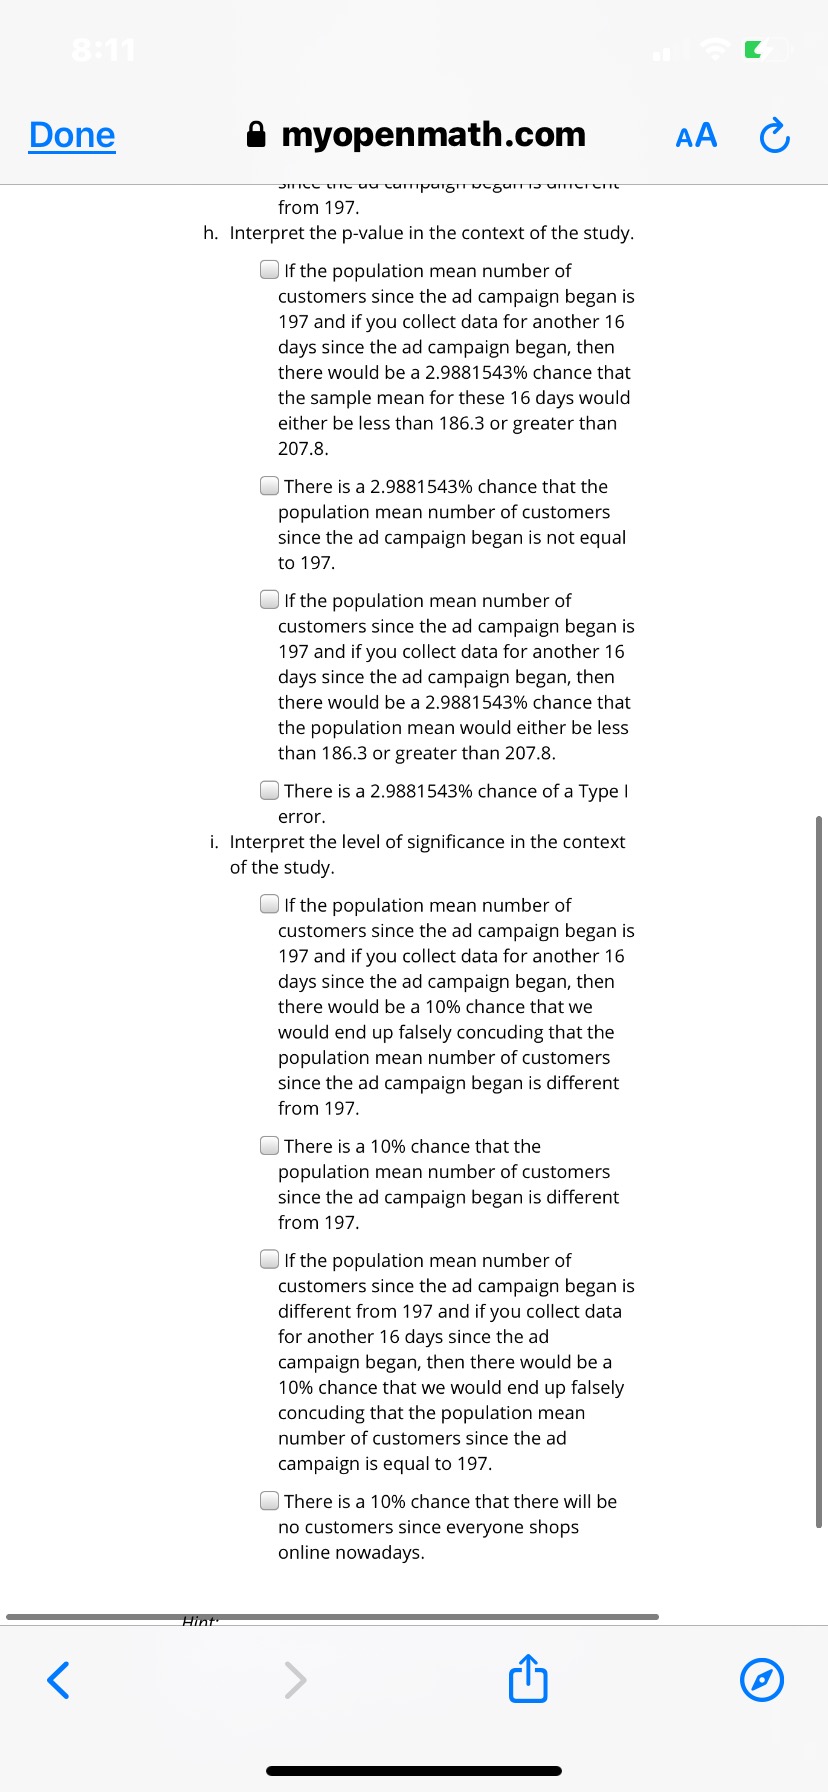
8:11 myopenmath.com Progress saved Done B & Voce : . Question 4 0/5 pts O 3 99 0 Details Before the furniture store began its ad campaign, it averaged 197 customers per day. The manager is investigating if the average has changed since the ad came out. The data for the 16 randomly selected days since the ad campaign began is shown below: 202, 177, 210, 163, 197, 169, 201, 195, 197, 189, 172, 163, 208, 165, 207, 165 Assuming that the distribution is normal, what can be concluded at the a = 0.10 level of significance? a. For this study, we should use Select an answer b. The null and alternative hypotheses would be: Ho: ? Select an answer H1 : ? Select an answer c. The test statistic (? = (please show your answer to 3 decimal places.) d. The p-value = (Please show your answer to 4 decimal places.) e. The p-value is ? a f. Based on this, we should ( Select an answer the null hypothesis. g. Thus, the final conclusion is that ... The data suggest the population mean is not significantly different from 197 at a = 0.10, so there is sufficient evidence to conclude that the population mean number of customers since the ad campaign began is equal to 197. The data suggest the populaton mean is significantly different from 197 at a = 0.10, so there is sufficient evidence to conclude that the population mean number of customers since the ad campaign began is different from 197. The data suggest that the population mean number of customers since the ad campaign began is not significantly different from 197 at a = 0.10, so there is insufficient evidence to conclude that the population mean number of customers since the ad campaign began is different from 197. h. Interpret the p-value in the context of the study. if the population mean number of customers since the ad campaign began is 197 and if you collect data for another 16 days since the ad campaign began, then there would be a 2.9881543% chance that the sample mean for these 16 days would an2:06 myopenmath.com Chapter y. myputiesis Tests TUI a Single Population Mean Score: 0/16 0/4 answered Progress saved Done B & Voce : . Question 1 0/3 pts 9 3 99 0 Details The average retirement age in America is 66 years old. Do small business owners retire at an older average age? The data below shows the results of a survey of small business owners who have recently retired. Assume that the distribution of the population is normal. 77, 71, 59, 69, 59, 77, 76, 59, 65, 75, 60, 63, 65 What can be concluded at the the a = 0.01 level of significance level of significance? a. For this study, we should use Select an answer b. The null and alternative hypotheses would be: Ho: ? Select an answer H 1 : ? Select an answer c. The test statistic ? = (please show your answer to 3 decimal places.) d. The p-value = (Please show your answer to 4 decimal places.) e. The p-value is ? a f. Based on this, we should ( Select an answer v the null hypothesis. g. Thus, the final conclusion is that ... O The data suggest the population mean is not significantly older than 66 at a = 0.01, so there is sufficient evidence to conclude that the population mean retirement age for small business owners is equal to 66. The data suggest the population mean retirement age for small business owners is not significantly older than 66 at a = 0.01, so there is insufficient evidence to conclude that the population mean retirement age for small business owners is older than 66. The data suggest the populaton mean is significantly older than 66 at a = 0.01, so there is sufficient evidence to conclude that the population mean retirement age for small business owners is older than 66. Hint: Helpful Videos: Calculations ) [+] Setup ) [+] Interpretations [+] HelpDone 0 myopen math.com AA is $49,100 and if another 62 singles are surveyed then there would be a 0.12161461% chance that the population mean salary for singles would be greater than $49,100. [3 If the population mean salary for singles is $49,100 and if another 62 singles are surveyed then there would be a 01216146196 chance that the sample mean for these 62 singles surveyed would be greater than $52,945. i. Interpret the level of signicance in the context of the study. 1:] There is a 1 '14: chance that you won the lottery, so you may not have to even have to worry about passing this class. C] If the population population mean salary for singles is greater than $49,100 and if another 62 singles are surveyed then there would be a 1% chance that we would end up falsely concluding that the population mean salary for singles is equal to $49,100. C] If the population mean salary for singles is $49,100 and if another 62 singles are surveyed then there would be a 1% chance that we would end up falsely concluding that the population mean salary for singles is greater than $49,100. [:1 There is a 1% chance that the population mean salary for singles is greater than $49,100. 2:07 myopenmath.com Chapter 9: Hypothesis Tests for a Single Population Mean Score: 0/16 0/4 answered Progress saved Done B & Voce : . Question 2 0/3 pts 9 3 99 0 Details The average American consumes 85 liters of alcohol per year. Does the average college student consume more alcohol per year? A researcher surveyed 15 randomly selected college students and found that they averaged 90.9 liters of alcohol consumed per year with a standard deviation of 25 liters. What can be concluded at the the a = 0.05 level of significance? a. For this study, we should use Select an answer b. The null and alternative hypotheses would be: Ho: ? Select an answer H1 : ? Select an answer c. The test statistic ? = (please show your answer to 3 decimal places.) d. The p-value = (Please show your answer to 4 decimal places.) e. The p-value is ? v a f. Based on this, we should ( Select an answer |the null hypothesis. g. Thus, the final conclusion is that ... The data suggest the populaton mean is significantly more than 85 at a = 0.05, so there is statistically significant evidence to conclude that the population mean amount of alcohol consumed by college students is more than 85 liters per year. The data suggest that the population mean amount of alcohol consumed by college students is not significantly more than 85 liters per year at a = 0.05, so there is statistically insignificant evidence to conclude that the population mean amount of alcohol consumed by college students is more than 85 liters per year. The data suggest the population mean is not significantly more than 85 at a = 0.05, so there is statistically insignificant evidence to conclude that the population mean amount of alcohol consumed by college students is equal to 85 liters per year. Hint: Helpful Videos: Calculations _ [+] Setup ) [+] Interpretations [+14:09 7 Conects 8:10 myopenmath.com . Question 3 0/5 pts 3 99 0 Details The average salary in this city is $49,100. Is the average more for single people? 62 randomly selected single people who were surveyed had an average salary of $52,945 and a standard deviation of $9,570. What can be concluded at the a = 0.01 level of significance? a. For this study, we should use Select an answer b. The null and alternative hypotheses would be: Ho: 2 7 Select an answer H1 : ? Select an answer c. The test statistic ? = (please show your answer to 3 decimal places.) d. The p-value = (Please show your answer to 4 decimal places.) e. The p-value is ? v a f. Based on this, we should Select an answer |the null hypothesis. g. Thus, the final conclusion is that ... The data suggest that the populaton mean is significantly greater than 49,100 at a = 0.01, so there is statistically significant evidence to conclude that the population mean salary for singles is greater than 49,100. The data suggest that the population mean is not significantly greater than 49,100 at a = 0.01, so there is statistically insignificant evidence to conclude that the population mean salary for singles is greater than 49,100. The data suggest that the sample mean is not significantly greater than 49,100 at a = 0.01, so there is statistically insignificant evidence to conclude that the sample mean salary for singles is greater than 52,945. h. Interpret the p-value in the context of the study. There is a 0.12161461% chance of a Type I error. There is a 0.12161461% chance that the population mean salary for singles is greater than $49,100 . if the population mean salary for singles is $49,100 and if another 62 singles are surveyed then there would be a 0.12161461% chance that the population mean salary for singles would be greater than $49,100. Oif the population mean salary for singles is $49,100 and if another 62 singles are12:44 Done myopenmath.com AA C Chapter 8: Confidence Intervals (Proportions) Score: 0/6 0/6 answered Progress saved Done . . . . Question 2 0/1 pt 5 3 99 0 Details Giving a test to a group of students, the grades and gender are summarized below A B C Total Male 20 8 16 44 Female 18 9 7 34 Total 38 17 23 78 Let p represent the population proportion of all male students who received a grade of A on this test. Use a 99.5% confidence interval to estimate p to four decimal places if possible.
