

Question: 9. An ANOVA table for testing linearity of regression is given below: Source of Variation Sum of Squares Degrees of Freedom Mean square Computed f
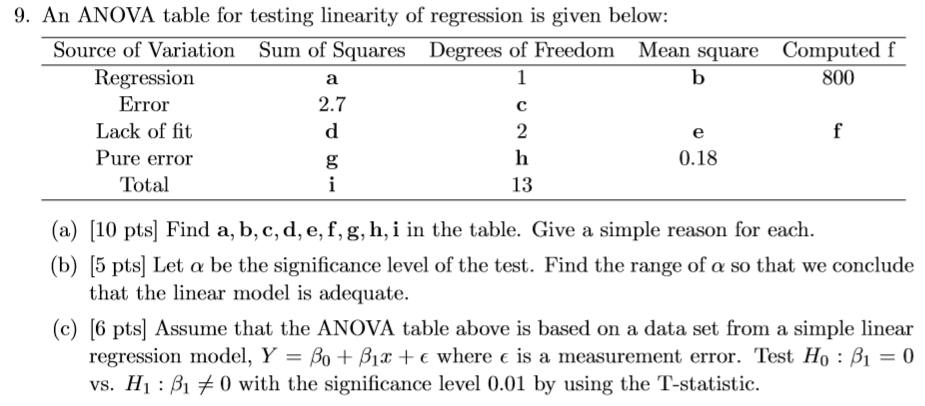
9. An ANOVA table for testing linearity of regression is given below: Source of Variation Sum of Squares Degrees of Freedom Mean square Computed f Regression a 1 b 800 Error Lack of fit d 2 e f Pure error h 0.18 Total 2.7 i 13 (a) [10 pts] Find a, b, c, d, e, f, g, h, i in the table. Give a simple reason for each. (b) (5 pts) Let a be the significance level of the test. Find the range of a so that we conclude that the linear model is adequate. (C) [6 pts) Assume that the ANOVA table above is based on a data set from a simple linear regression model, Y = Bo + Bix te where e is a measurement error. Test Ho : Bi = 0 vs. H : B1 #0 with the significance level 0.01 by using the T-statistic. 9. An ANOVA table for testing linearity of regression is given below: Source of Variation Sum of Squares Degrees of Freedom Mean square Computed f Regression a 1 b 800 Error Lack of fit d 2 e f Pure error h 0.18 Total 2.7 i 13 (a) [10 pts] Find a, b, c, d, e, f, g, h, i in the table. Give a simple reason for each. (b) (5 pts) Let a be the significance level of the test. Find the range of a so that we conclude that the linear model is adequate. (C) [6 pts) Assume that the ANOVA table above is based on a data set from a simple linear regression model, Y = Bo + Bix te where e is a measurement error. Test Ho : Bi = 0 vs. H : B1 #0 with the significance level 0.01 by using the T-statistic
Step by Step Solution
There are 3 Steps involved in it

Get step-by-step solutions from verified subject matter experts