

Question
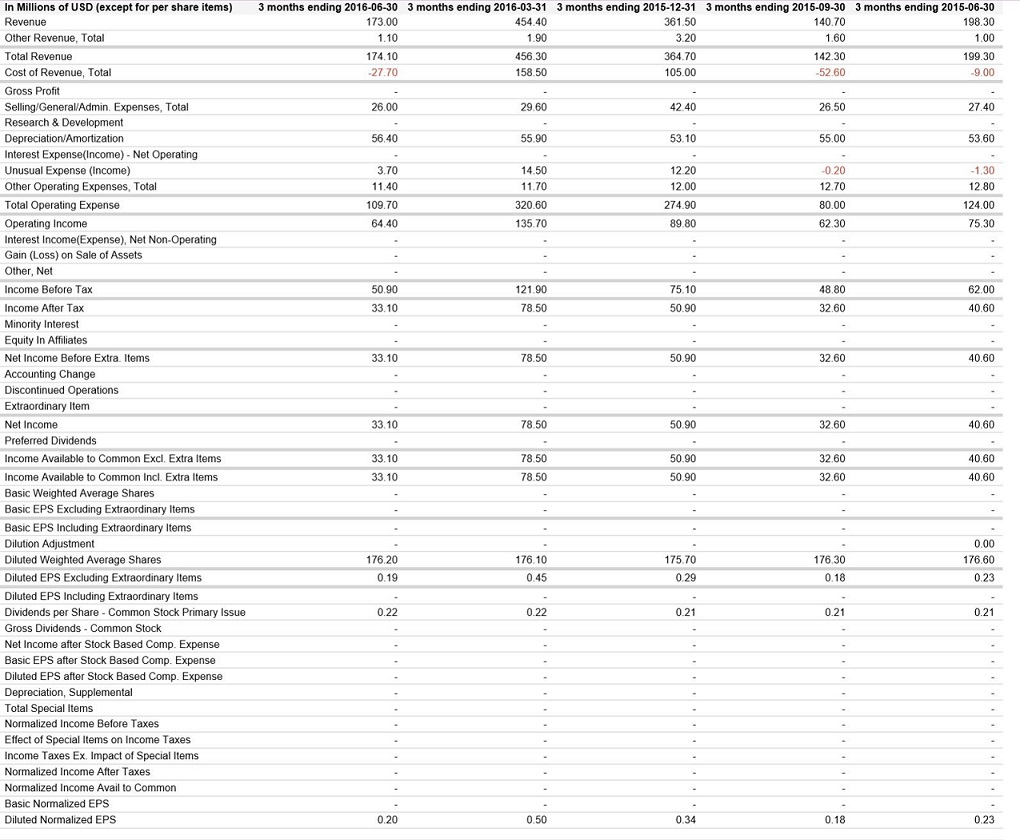
A. 3 year horizontal trend analysis of key financial data (you determine what is the relevant data), comments on any significant changes or trends. B.
A. 3 year horizontal trend analysis of key financial data (you determine what is the relevant data), comments on any significant changes or trends.
B. Vertical analysis of the 2015 & 2014 Balance Sheets and Income Statements. Comment on the areas that posted significant changes from the prior year.
Step by Step Solution
There are 3 Steps involved in it
Step: 1

Get Instant Access to Expert-Tailored Solutions
See step-by-step solutions with expert insights and AI powered tools for academic success
Step: 2

Step: 3
Ace Your Homework with AI
Get the answers you need in no time with our AI-driven, step-by-step assistance
Get Started
Financial Accounting A Management Perspective
Authors: Nelson Macwan
1st Edition
6206142191, 978-6206142195