Answered step by step
Verified Expert Solution
Link Copied!

Question

1 Approved Answer

A) Assume that the graph below is the loanable funds market. Identify curves 1 and 2 and each axis. (5pts) 2 X 1 B) Referencing
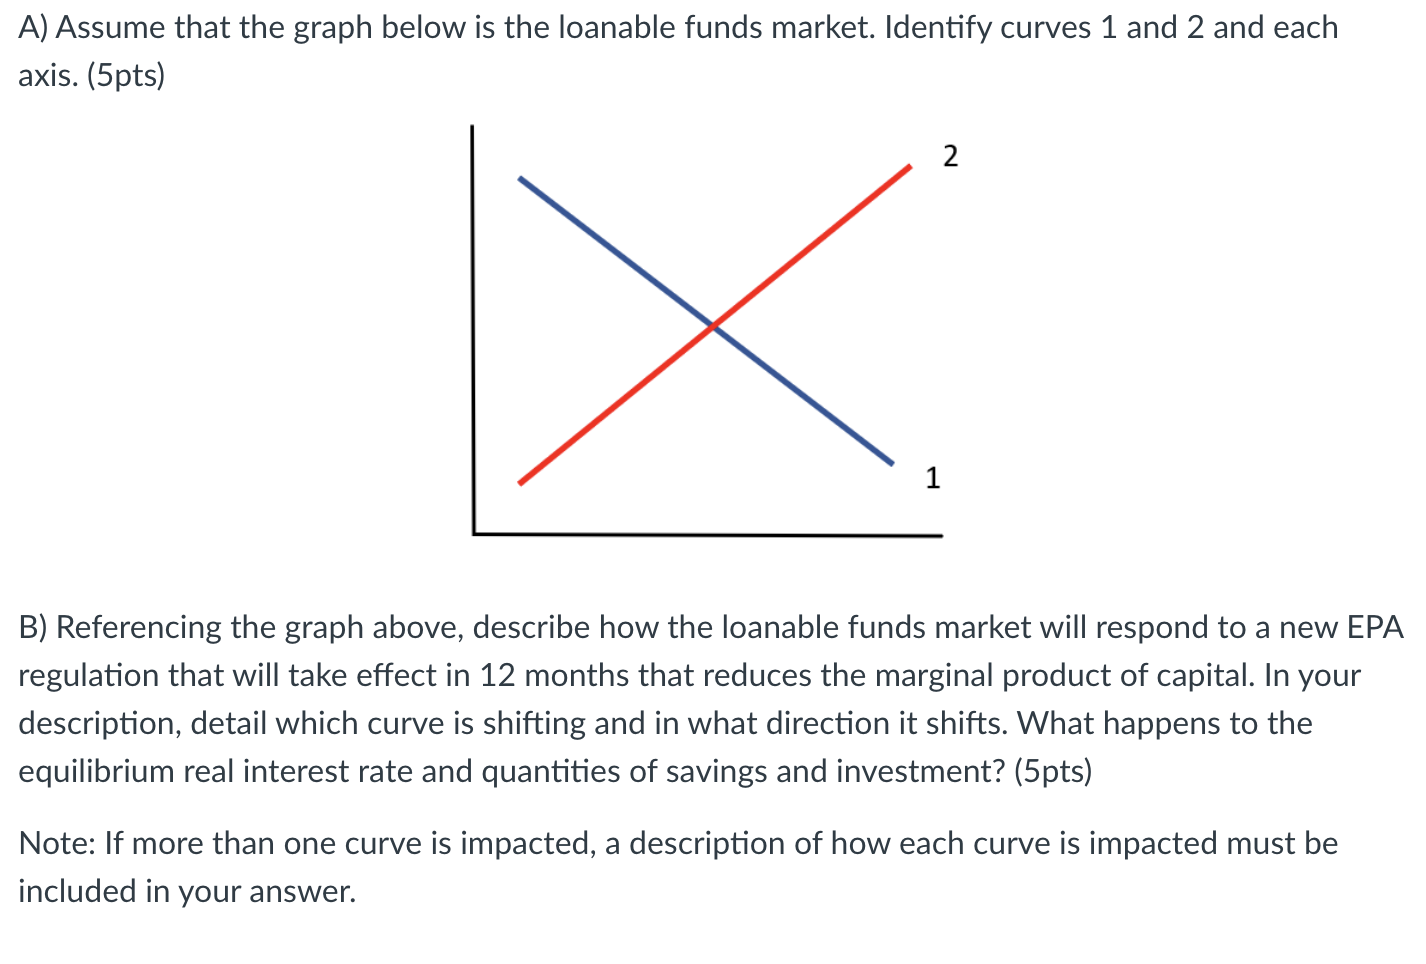
image text in transcribed

A) Assume that the graph below is the loanable funds market. Identify curves 1 and 2 and each axis. (5pts) 2 X 1 B) Referencing the graph above, describe how the loanable funds market will respond to a new EPA regulation that will take effect in 12 months that reduces the marginal product of capital. In your description, detail which curve is shifting and in what direction it shifts. What happens to the equilibrium real interest rate and quantities of savings and investment? (5pts) Note: If more than one curve is impacted, a description of how each curve is impacted must be included in your

Step by Step Solution

There are 3 Steps involved in it

Step: 1

blur-text-image

Get Instant Access to Expert-Tailored Solutions

See step-by-step solutions with expert insights and AI powered tools for academic success

Step: 2

blur-text-image_2

Step: 3

blur-text-image_3

Ace Your Homework with AI

Get the answers you need in no time with our AI-driven, step-by-step assistance

Get Started

Recommended Textbook for

Essentials Of Applied Econometrics

Authors: Aaron D Smith, J Edward Taylor

1st Edition

0520288335, 9780520288331

More Books

Students also viewed these Economics questions

Question

What is the difference between nominal and real interest rates?

Answered: 1 week ago