Answered step by step
Verified Expert Solution
Question
1 Approved Answer
a. b. An insurance company gathered data on a representative sample of 98 policies that have been in force for the past 5 years.

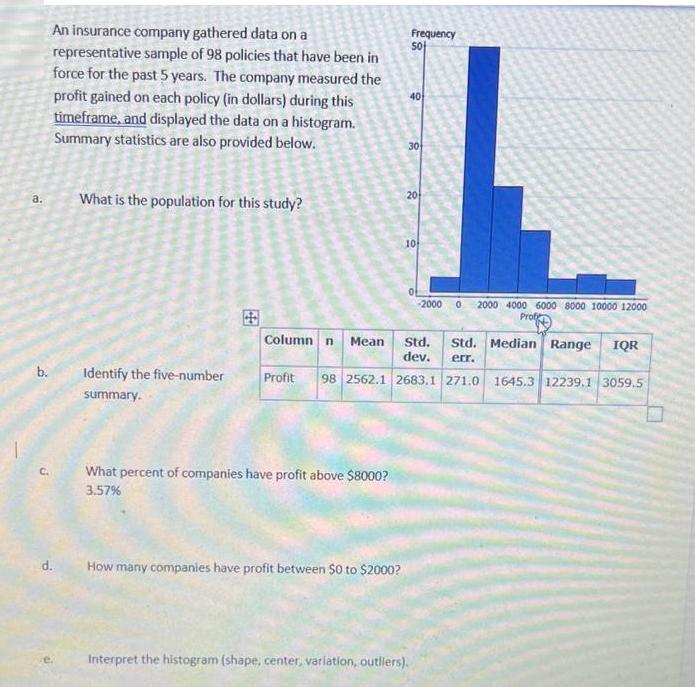
a. b. An insurance company gathered data on a representative sample of 98 policies that have been in force for the past 5 years. The company measured the profit gained on each policy (in dollars) during this timeframe, and displayed the data on a histogram. Summary statistics are also provided below. What is the population for this study? Identify the five-number summary. Column n Mean What percent of companies have profit above $8000? 3.57% d. How many companies have profit between $0 to $2000? Frequency 50+ 30 20 Std. dev. Std. Median Range IQR err. Profit 98 2562.1 2683.1 271.0 1645.3 12239.1 3059.5 10 Interpret the histogram (shape, center, variation, outliers). -2000 0 2000 4000 6000 8000 10000 12000 Prof
Step by Step Solution
★★★★★
3.56 Rating (174 Votes )
There are 3 Steps involved in it
Step: 1
a The population for this study is all policies that have been in force for the past 5 years in the ...
Get Instant Access to Expert-Tailored Solutions
See step-by-step solutions with expert insights and AI powered tools for academic success
Step: 2

Step: 3

Ace Your Homework with AI
Get the answers you need in no time with our AI-driven, step-by-step assistance
Get Started


