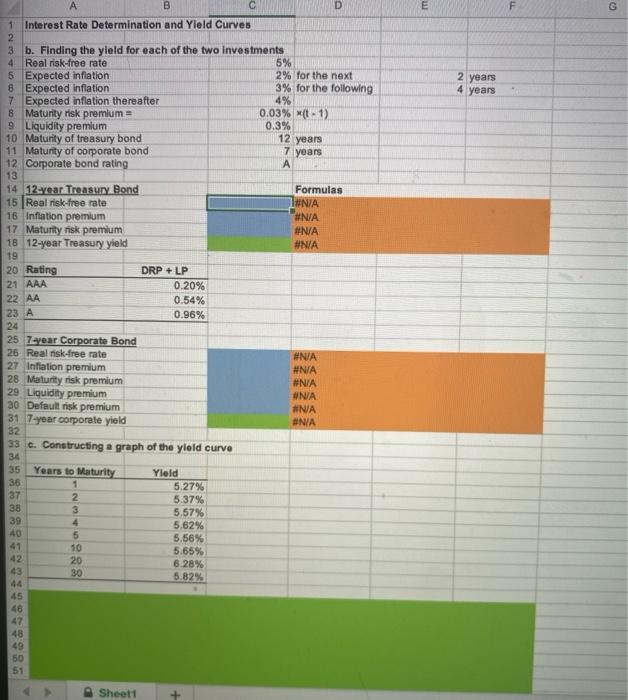
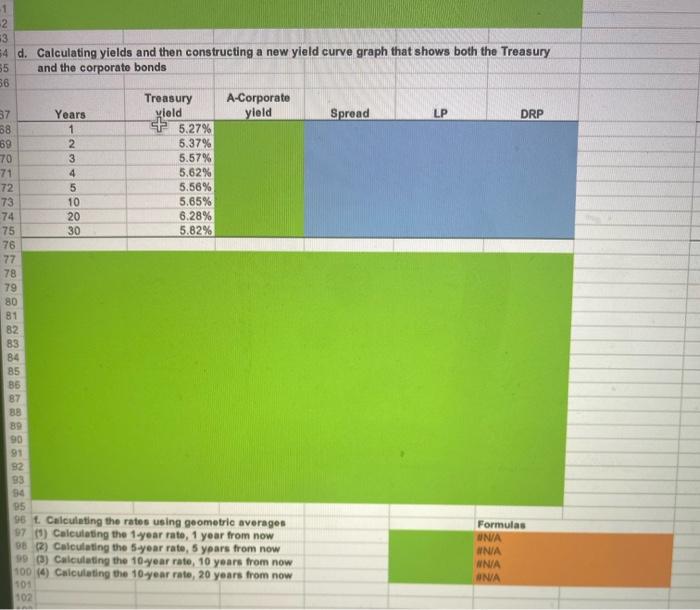
A B C D 1 Interest Rate Determination and Yield Curves 2 3 b. Finding the yield for each of the two investments 4 Real risk-free rate 5% 5 Expected inflation 2% for the next 3% for the following 6 Expected inflation 7 Expected inflation thereafter 4% 8 Maturity risk premium = 0.03% (t-1) 9 Liquidity premium 0.3% 10 Maturity of treasury bond 12 years 7 years 11 Maturity of corporate bond 12 Corporate bond rating A 13 14 12-year Treasury Bond 15 Real risk-free rate 16 Inflation premium 17 Maturity risk premium 18 12-year Treasury yield 19 20 Rating 21 AAA 0.20% 22 AA 0.54% 0.96% 23 A 24 25 7-year Corporate Bond 26 Real risk-free rate 27 Inflation premium 28 Maturity risk premium 29 Liquidity premium 30 Default risk premium 31 7-year corporate yield 32 33 c. Constructing a graph of the yield curve 34 35 Years to Maturity Yield 36 1 5.27% 37 2 5.37% 38 3 5.57% 39 4 5.62% 40 5 5.56% 41 5.65% 42 6.28% 43 5.82% 44 45 46 47 48 49 50 51 4567 298 288 10 20 30 Sheet1 DRP + LP Formulas #N/A #N/A #N/A #N/A #N/A #N/A #N/A #N/A #N/A #N/A E 2 years 4 years G -2 3 4 d. Calculating yields and then constructing a new yield curve graph that shows both the Treasury and the corporate bonds 35 36 Treasury yield A-Corporate yield 37 Years Spread LP DRP 68 1 5.27% 5.37% 69 70 71 5.57% 5.62% 72 5.56% 73 5.65% 74 6.28% 5.82% 75 76 77 78 79 80 81 82 83 84 85 86 87 88 89 90 91 92 93 94 95 96 1. Calculating the rates using geometric averages 97 (1) Calculating the 1-year rate, 1 year from now 98 (2) Calculating the 5-year rate, 5 years from now 99 (3) Calculating the 10-year rate, 10 years from now 100 (4) Calculating the 10-year rate, 20 years from now 101 102 8859AWN- 10 20 30 Formulas UN/A #N/A #N/A #N/A A B C D 1 Interest Rate Determination and Yield Curves 2 3 b. Finding the yield for each of the two investments 4 Real risk-free rate 5% 5 Expected inflation 2% for the next 3% for the following 6 Expected inflation 7 Expected inflation thereafter 4% 8 Maturity risk premium = 0.03% (t-1) 9 Liquidity premium 0.3% 10 Maturity of treasury bond 12 years 7 years 11 Maturity of corporate bond 12 Corporate bond rating A 13 14 12-year Treasury Bond 15 Real risk-free rate 16 Inflation premium 17 Maturity risk premium 18 12-year Treasury yield 19 20 Rating 21 AAA 0.20% 22 AA 0.54% 0.96% 23 A 24 25 7-year Corporate Bond 26 Real risk-free rate 27 Inflation premium 28 Maturity risk premium 29 Liquidity premium 30 Default risk premium 31 7-year corporate yield 32 33 c. Constructing a graph of the yield curve 34 35 Years to Maturity Yield 36 1 5.27% 37 2 5.37% 38 3 5.57% 39 4 5.62% 40 5 5.56% 41 5.65% 42 6.28% 43 5.82% 44 45 46 47 48 49 50 51 4567 298 288 10 20 30 Sheet1 DRP + LP Formulas #N/A #N/A #N/A #N/A #N/A #N/A #N/A #N/A #N/A #N/A E 2 years 4 years G -2 3 4 d. Calculating yields and then constructing a new yield curve graph that shows both the Treasury and the corporate bonds 35 36 Treasury yield A-Corporate yield 37 Years Spread LP DRP 68 1 5.27% 5.37% 69 70 71 5.57% 5.62% 72 5.56% 73 5.65% 74 6.28% 5.82% 75 76 77 78 79 80 81 82 83 84 85 86 87 88 89 90 91 92 93 94 95 96 1. Calculating the rates using geometric averages 97 (1) Calculating the 1-year rate, 1 year from now 98 (2) Calculating the 5-year rate, 5 years from now 99 (3) Calculating the 10-year rate, 10 years from now 100 (4) Calculating the 10-year rate, 20 years from now 101 102 8859AWN- 10 20 30 Formulas UN/A #N/A #N/A #N/A


