Answered step by step
Verified Expert Solution
Link Copied!

Question

1 Approved Answer

A B C D E F G H K M N O P 0.2 Sales Squared 20 points Week Exponential Squared Moving Smoothing error average
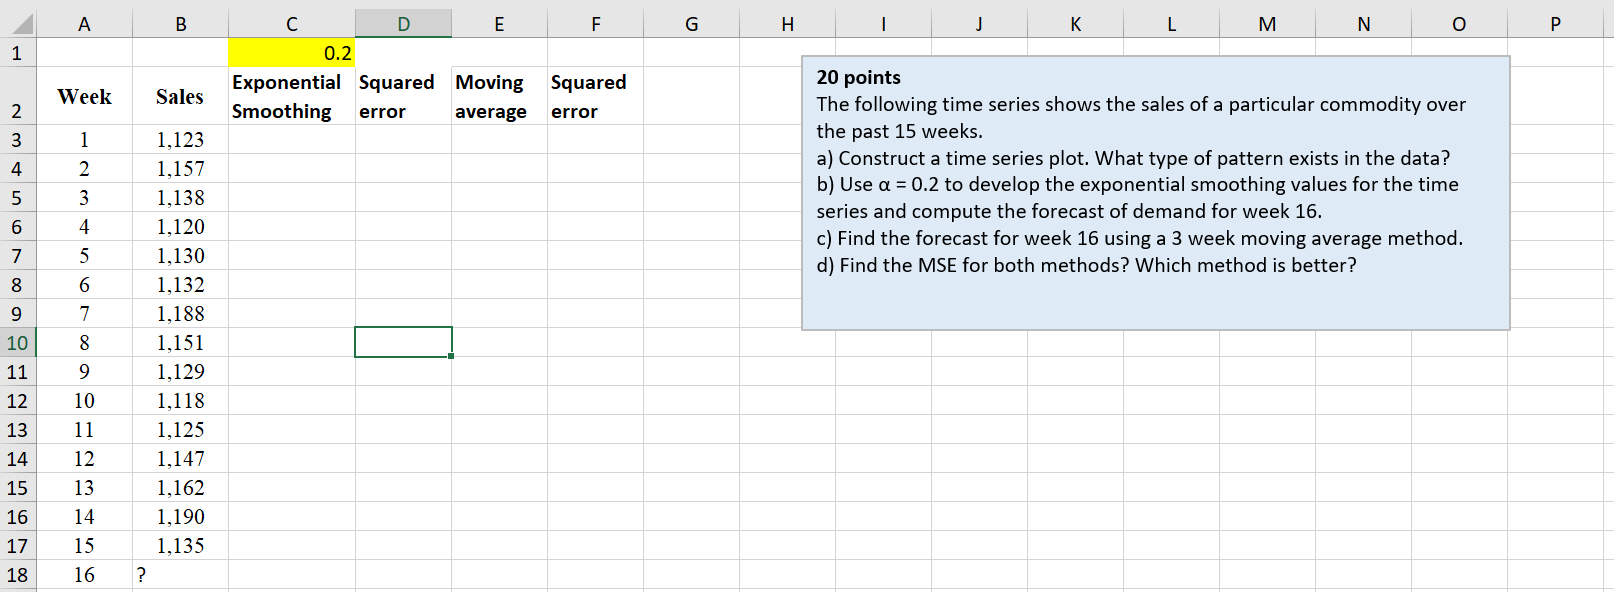
image text in transcribed
A B C D E F G H K M N O P 0.2 Sales Squared 20 points Week Exponential Squared Moving Smoothing error average error The following time series shows the sales of a particular commodity over W N 1,123 the past 15 weeks. 1,157 a) Construct a time series plot. What type of pattern exists in the data? 1,138 b) Use a = 0.2 to develop the exponential smoothing values for the time 1,120 series and compute the forecast of demand for week 16. LO OO VOI UT A 1,130 c) Find the forecast for week 16 using a 3 week moving average method. 1,132 d) Find the MSE for both methods? Which method is better? 1,188 8 1,151 11 9 1,129 12 10 1,118 13 11 1,125 14 12 1,147 15 13 1,162 16 14 1,190 17 15 1,135 18 16

Step by Step Solution

There are 3 Steps involved in it

Step: 1

blur-text-image

Get Instant Access to Expert-Tailored Solutions

See step-by-step solutions with expert insights and AI powered tools for academic success

Step: 2

blur-text-image

Step: 3

blur-text-image

Ace Your Homework with AI

Get the answers you need in no time with our AI-driven, step-by-step assistance

Get Started

Recommended Textbook for

Trigonometry

Authors: Cynthia Y Young

5th Edition

1119820928, 9781119820925

More Books

Students also viewed these Mathematics questions