Answered step by step
Verified Expert Solution
Link Copied!

Question

1 Approved Answer

A B c D m F F G H Use Excel to graph the combinations of standard deviations of return (x-axis) and expected return (y-axis)
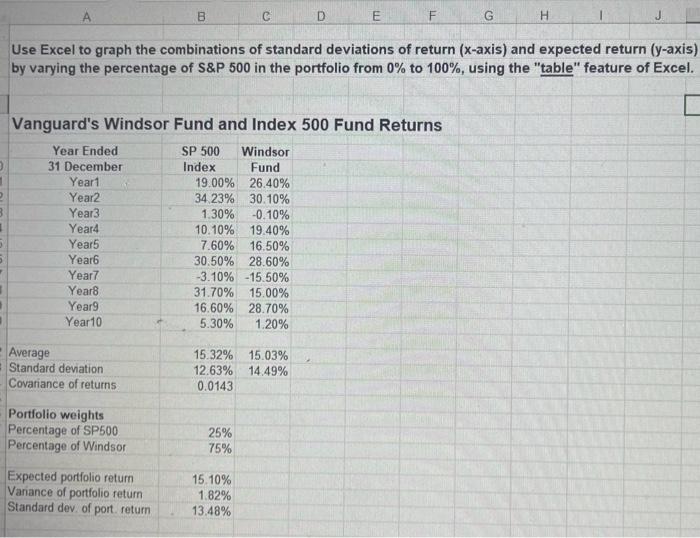
image text in transcribed
A B c D m F F G H Use Excel to graph the combinations of standard deviations of return (x-axis) and expected return (y-axis) by varying the percentage of S&P 500 in the portfolio from 0% to 100%, using the "table" feature of Excel. Vanguard's Windsor Fund and Index 500 Fund Returns Year Ended 31 December Yeart Year2 Year3 Year4 Years Year6 Year7 Year8 Year 9 Year 10 SP 500 Windsor Index Fund 19.00% 26.40% 34 23% 30.10% 1.30% -0.10% 10.10% 19.40% 7.60% 16.50% 30.50% 28.60% -3.10% -15.50% 31.70% 15.00% 16.60% 28.70% 5.30% 1.20% Average Standard deviation Covariance of returns 15.32% 15.03% 12.63% 14.49% 0.0143 Portfolio weights Percentage of SP500 Percentage of Windsor 25% 75% Expected portfolio return Variance of portfolio return Standard dev. of portreturn 15. 10% 1.82% 13,48%

Step by Step Solution

There are 3 Steps involved in it

Step: 1

blur-text-image

Get Instant Access to Expert-Tailored Solutions

See step-by-step solutions with expert insights and AI powered tools for academic success

Step: 2

blur-text-image

Step: 3

blur-text-image

Ace Your Homework with AI

Get the answers you need in no time with our AI-driven, step-by-step assistance

Get Started

Recommended Textbook for

Intermediate Financial Management

Authors: Brigham, Daves

10th Edition

978-1439051764, 1111783659, 9780324594690, 1439051763, 9781111783655, 324594690, 978-1111021573

More Books

Students also viewed these Finance questions

Question

Outline a possible synthesis of the following compound. HO HO

Answered: 1 week ago

Question

4-25. You neglected to sign the enclosed contract.

Answered: 1 week ago

Question

4-27. You failed to enclose your instructions for your new will.

Answered: 1 week ago