

Answered step by step
Verified Expert Solution
Question
1 Approved Answer
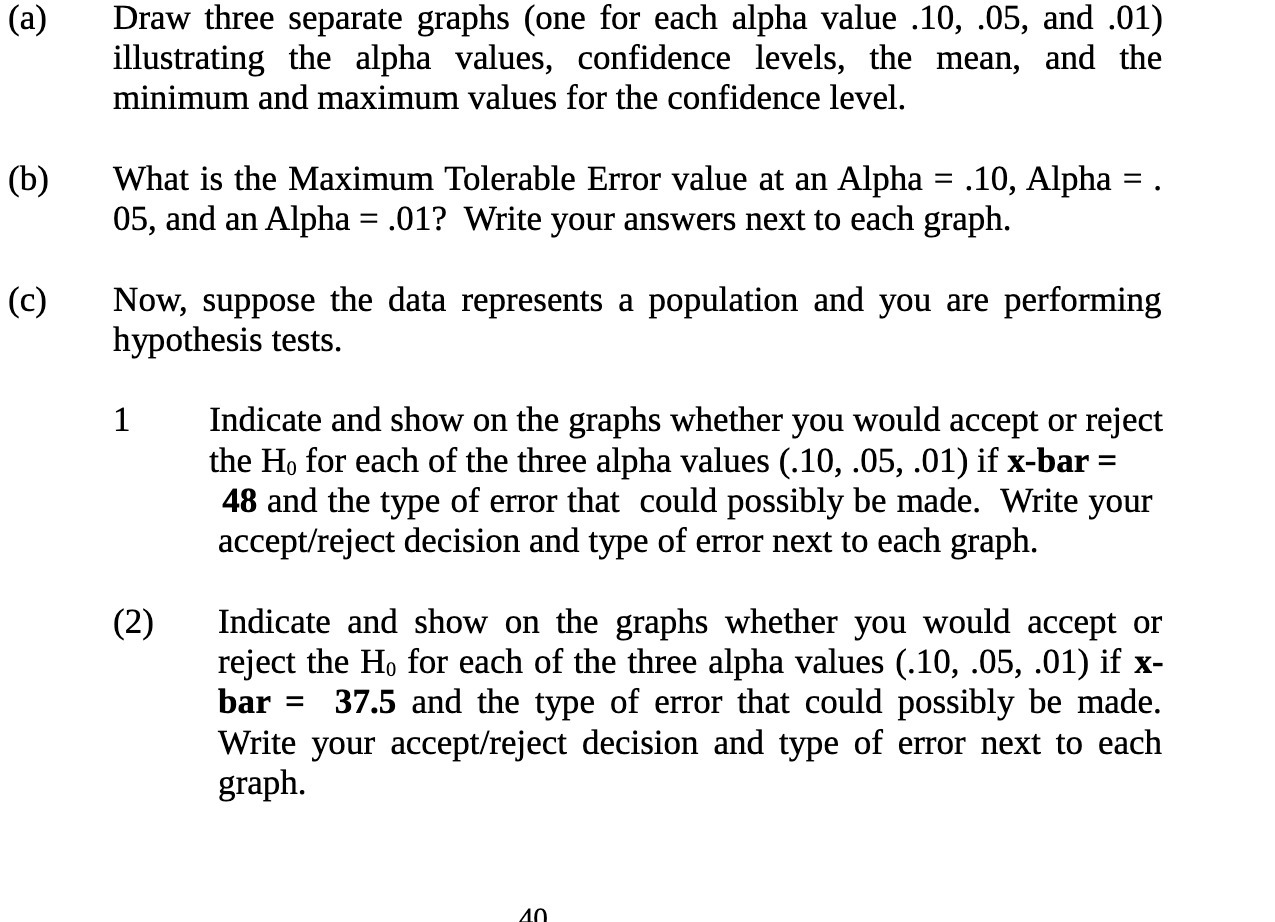
(a) (b) (C) Draw three separate graphs (one for each alpha value .10, .05, and .01) illustrating the alpha values, confidence levels, the mean, and
Step by Step Solution
There are 3 Steps involved in it
Step: 1

Get Instant Access to Expert-Tailored Solutions
See step-by-step solutions with expert insights and AI powered tools for academic success
Step: 2

Step: 3
Ace Your Homework with AI
Get the answers you need in no time with our AI-driven, step-by-step assistance
Get Started
Algebra 2
Authors: John A. Carter, Gilbert J. Cuevas, Roger Day, Carol Malloy, Berchie Holliday, Ruth M. Casey
Common Core Edition
0076639908, 978-0076639908