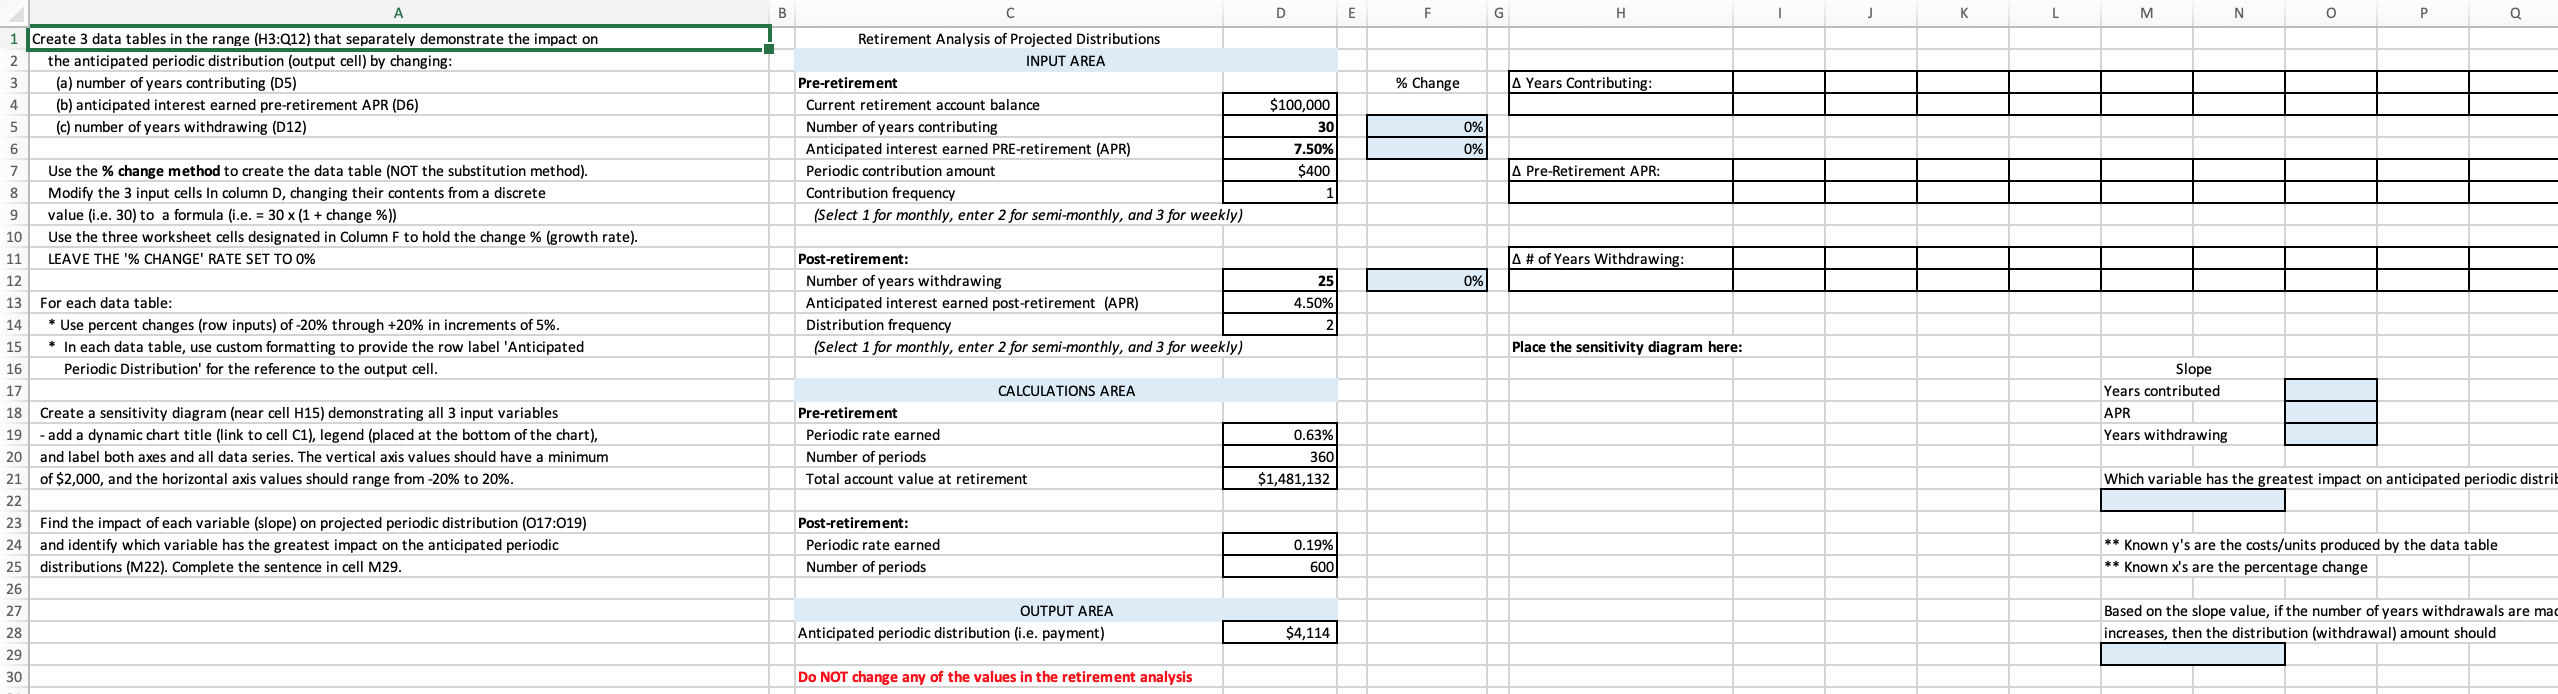
A B D E F G H L M N O Q 1 Create 3 data tables in the range (H3:Q12) that separately demonstrate the impact on 2 the anticipated periodic distribution (output cell) by changing: 3 (a) number of years contributing (D5) 4 (b) anticipated interest earned pre-retirement APR (D6) 5 (c) number of years withdrawing (012) % Change A Years Contributing: Retirement Analysis of Projected Distributions INPUT AREA Pre-retirement Current retirement account balance Number of years contributing Anticipated interest earned PRE-retirement (APR) Periodic contribution amount Contribution frequency (Select 1 for monthly, enter 2 for semi-monthly, and 3 for weekly) 0% $100,000 30 7.50% $400 6 0% A Pre-Retirement APR: 9 A# of Years Withdrawing: 0% Post-retirement: Number of years withdrawing Anticipated interest earned post-retirement (APR) Distribution frequency (Select 1 for monthly, enter 2 for semi-monthly, and 3 for weekly) 25 4.50% 2 Place the sensitivity diagram here: 7 Use the % change method to create the data table (NOT the substitution method). 8 Modify the 3 input cells in column D, changing their contents from a discrete value (i.e. 30) to a formula (i.e. = 30 x (1 + change %)) 10 Use the three worksheet cells designated in Column F to hold the change % (growth rate). 11 LEAVE THE '% CHANGE RATE SET TO 0% 12 13 For each data table: 14 * Use percent changes (row inputs) of -20% through +20% in increments of 5%. 15 * In each data table, use custom formatting to provide the row label 'Anticipated 16 Periodic Distribution for the reference to the output cell. 17 18 Create a sensitivity diagram (near cell H15) demonstrating all 3 input variables 19 -add a dynamic chart title (link to cell C1), legend (placed at the bottom of the chart), 20 and label both axes and all data series. The vertical axis values should have a minimum 21 of $2,000, and the horizontal axis values should range from -20% to 20%. 22 23 Find the impact of each variable (slope) on projected periodic distribution (017:019) 24 and identify which variable has the greatest impact on the anticipated periodic 25 distributions (M22). Complete the sentence in cell M29. 26 CALCULATIONS AREA Pre-retirement Periodic rate earned Number of periods Total account value at retirement Slope Years contributed APR Years withdrawing 0.63% 3601 $1,481,132 Which variable has the greatest impact on anticipated periodic distri Post-retirement: Periodic rate earned Number of periods 0.19% 600 ** Known y's are the costs/units produced by the data table ** Known x's are the percentage change 27 OUTPUT AREA Anticipated periodic distribution (i.e. payment) Based on the slope value, if the number of years withdrawals are mad increases, then the distribution (withdrawal) amount should 28 $4,114 29 30 Do NOT change any of the values in the retirement analysis A B D E F G H L M N O Q 1 Create 3 data tables in the range (H3:Q12) that separately demonstrate the impact on 2 the anticipated periodic distribution (output cell) by changing: 3 (a) number of years contributing (D5) 4 (b) anticipated interest earned pre-retirement APR (D6) 5 (c) number of years withdrawing (012) % Change A Years Contributing: Retirement Analysis of Projected Distributions INPUT AREA Pre-retirement Current retirement account balance Number of years contributing Anticipated interest earned PRE-retirement (APR) Periodic contribution amount Contribution frequency (Select 1 for monthly, enter 2 for semi-monthly, and 3 for weekly) 0% $100,000 30 7.50% $400 6 0% A Pre-Retirement APR: 9 A# of Years Withdrawing: 0% Post-retirement: Number of years withdrawing Anticipated interest earned post-retirement (APR) Distribution frequency (Select 1 for monthly, enter 2 for semi-monthly, and 3 for weekly) 25 4.50% 2 Place the sensitivity diagram here: 7 Use the % change method to create the data table (NOT the substitution method). 8 Modify the 3 input cells in column D, changing their contents from a discrete value (i.e. 30) to a formula (i.e. = 30 x (1 + change %)) 10 Use the three worksheet cells designated in Column F to hold the change % (growth rate). 11 LEAVE THE '% CHANGE RATE SET TO 0% 12 13 For each data table: 14 * Use percent changes (row inputs) of -20% through +20% in increments of 5%. 15 * In each data table, use custom formatting to provide the row label 'Anticipated 16 Periodic Distribution for the reference to the output cell. 17 18 Create a sensitivity diagram (near cell H15) demonstrating all 3 input variables 19 -add a dynamic chart title (link to cell C1), legend (placed at the bottom of the chart), 20 and label both axes and all data series. The vertical axis values should have a minimum 21 of $2,000, and the horizontal axis values should range from -20% to 20%. 22 23 Find the impact of each variable (slope) on projected periodic distribution (017:019) 24 and identify which variable has the greatest impact on the anticipated periodic 25 distributions (M22). Complete the sentence in cell M29. 26 CALCULATIONS AREA Pre-retirement Periodic rate earned Number of periods Total account value at retirement Slope Years contributed APR Years withdrawing 0.63% 3601 $1,481,132 Which variable has the greatest impact on anticipated periodic distri Post-retirement: Periodic rate earned Number of periods 0.19% 600 ** Known y's are the costs/units produced by the data table ** Known x's are the percentage change 27 OUTPUT AREA Anticipated periodic distribution (i.e. payment) Based on the slope value, if the number of years withdrawals are mad increases, then the distribution (withdrawal) amount should 28 $4,114 29 30 Do NOT change any of the values in the retirement analysis