

Answered step by step
Verified Expert Solution
Question
1 Approved Answer
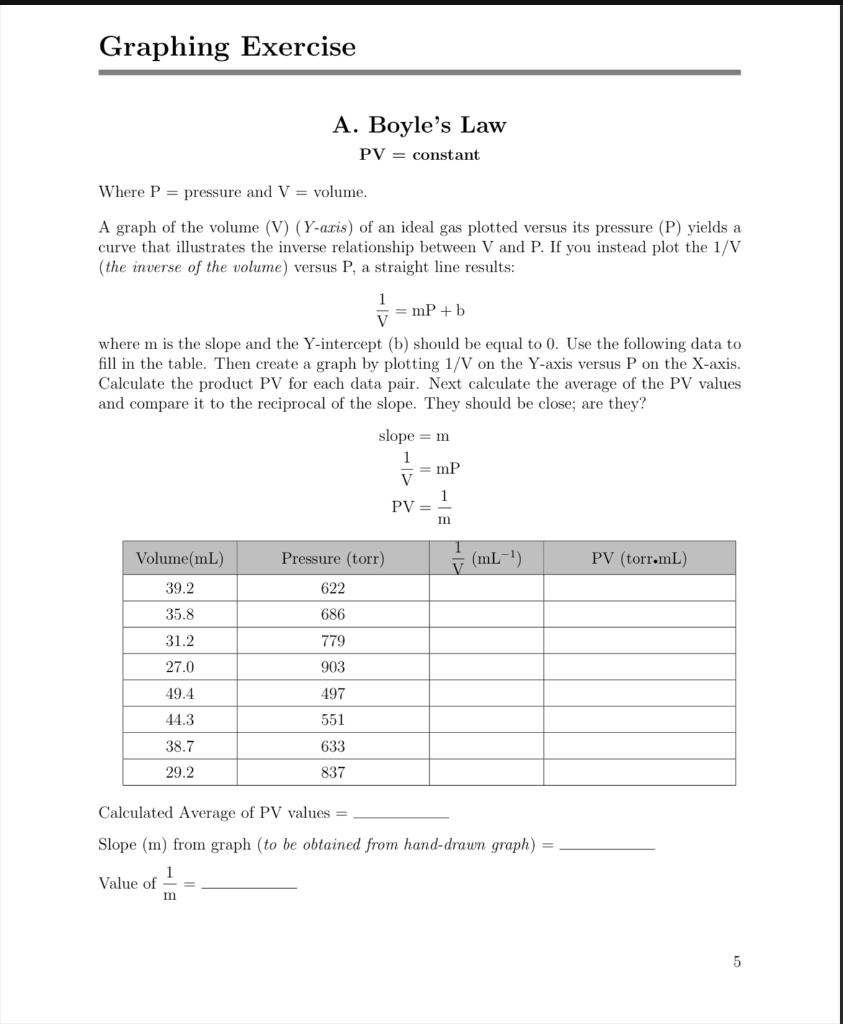
A. Boyle's Law PV=constant Where P= pressure and V= volume. A graph of the volume (V) ( Y-axis) of an ideal gas plotted versus its

Step by Step Solution
There are 3 Steps involved in it
Step: 1

Get Instant Access to Expert-Tailored Solutions
See step-by-step solutions with expert insights and AI powered tools for academic success
Step: 2

Step: 3
Ace Your Homework with AI
Get the answers you need in no time with our AI-driven, step-by-step assistance
Get Started
Chemistry
Authors: John McMurry, Robert C. Fay, Ph.D. Dillon, Stephanie
5th Edition
136128890, 978-0136128892