

Question
a) Calculate the seven ratios in the financial analysis map for 2017 and 2016. Show your calculations, You do not need to show the Supprting
a) Calculate the seven ratios in the financial analysis map for 2017 and 2016. Show your calculations, You do not need to show the "Supprting Calculations."
Ratio #1. Return on Equity (ROE)
Ratio #2: Operating return on Assets (Operating ROA)
Ratio #3. Financial Leverage Effect
Ratio #4. Spread
Ratio #5. Financial Leverage
Ratio #6. Net operating asset turnover
Ratio #7. Net operating profit after tax margin (NOPAT margin)
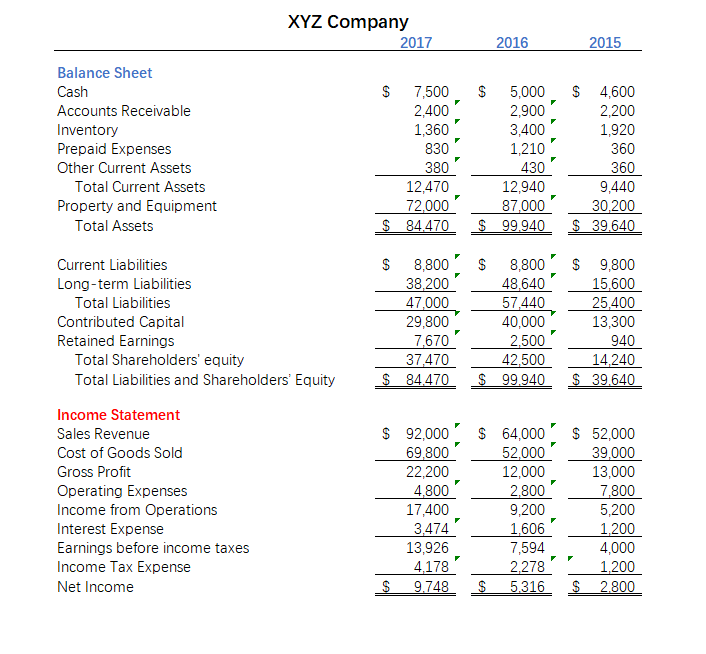
XYZ Company 2017 2016 2015 Balance Sheet Cash Accounts Receivable Inventory Prepaid Expenses Other Current Assets Total Current Assets Property and Equipment Total Assets $ 7,500 2,400 1,360 830 380 12,470 72.000 $ 84.470 $ 5,000 2,900 3,400 1,210 430 12,940 87,000 $ 99.940 $ 4,600 2,200 1,920 360 360 9,440 30,200 $ 39.640 Current Liabilities Long-term Liabilities Total Liabilities Contributed Capital Retained Earnings Total Shareholders' equity Total Liabilities and Shareholders' Equity $ 8,800 38,200 47,000 29,800 7,670 37.470 $ 84.470 $ 8,800 48,640 57,440 40,000 2.500 42,500 $ 99.940 $ 9,800 15,600 25,400 13,300 940 14,240 $ 39.640 Income Statement Sales Revenue Cost of Goods Sold Gross Profit Operating Expenses Income from Operations Interest Expense Earnings before income taxes Income Tax Expense Net Income $ 92,000 69,800 22,200 4.800 17,400 3,474 13,926 4,178 $ 9.748 $ 64,000 52.000 12,000 2.800 9,200 1,606 7,594 2,278 $ 5.316 $ 52,000 39,000 13,000 7,800 5,200 1.200 4,000 1.200 $ 2.800
Step by Step Solution
There are 3 Steps involved in it
Step: 1

Get Instant Access to Expert-Tailored Solutions
See step-by-step solutions with expert insights and AI powered tools for academic success
Step: 2

Step: 3
Ace Your Homework with AI
Get the answers you need in no time with our AI-driven, step-by-step assistance
Get Started
Accounting For Governments From Budget To Audit How Governments Plan Raise Spend And Then Account For Their Use Of Citizens Money In The 21st Century
Authors: Michael Parry, Jesse Hughes
1st Edition
1092763112, 978-1092763110