Answered step by step
Verified Expert Solution
Question
1 Approved Answer
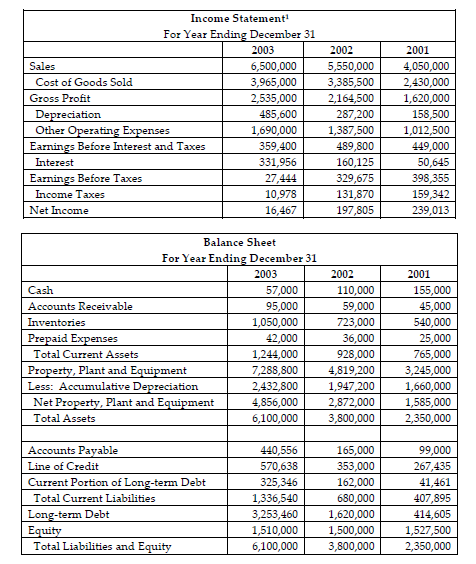
A) Cash Conversion Efficiency of the above data B) Cash Conversion Cycle of the above data Income Statement For Year Ending December 31 2003 Sales

A) Cash Conversion Efficiency of the above data
B) Cash Conversion Cycle of the above data
Income Statement For Year Ending December 31 2003 Sales 6,500,000 Cost of Goods Sold 3,965,000 Gross Profit 2,535,000 Depreciation 485,600 Other Operating Expenses 1,690,000 Earnings Before Interest and Taxes 359,400 Interest 331,956 Earnings Before Taxes 27,444 Income Taxes 10,978 Net Income 16,467 2002 5,550,000 3,385,500 2,164,500 287,200 1,387,500 489,800 160,125 329,675 131,870 197,805 2001 4,050,000 2,430,000 1,620,000 158,500 1,012,500 449,000 50,645 398,355 159,342 239,013 Balance Sheet For Year Ending December 31 2003 2002 Cash 57,000 110,000 Accounts Receivable 95,000 59,000 Inventories 1,050,000 723,000 Prepaid Expenses 42,000 36,000 Total Current Assets 1,244,000 928,000 Property, Plant and Equipment 7,288,800 4,819,200 Less: Accumulative Depreciation 2,432,800 1,947,200 Net Property, Plant and Equipment 4,856,000 2,872,000 Total Assets 6,100,000 3,800,000 2001 155,000 45,000 540,000 25,000 765,000 3,245,000 1,660,000 1,585,000 2,350,000 Accounts Payable Line of Credit Current Portion of Long-term Debt Total Current Liabilities Long-term Debt Equity Total Liabilities and Equity 440,556 570,638 325,346 1,336,540 3,253,460 1,510,000 6,100,000 165,000 353,000 162,000 680,000 1,620,000 1,500,000 3,800,000 99,000 267,435 41,461 407,895 414,605 1,527,500 2,350,000Step by Step Solution
There are 3 Steps involved in it
Step: 1

Get Instant Access to Expert-Tailored Solutions
See step-by-step solutions with expert insights and AI powered tools for academic success
Step: 2

Step: 3

Ace Your Homework with AI
Get the answers you need in no time with our AI-driven, step-by-step assistance
Get Started


