Answered step by step
Verified Expert Solution
Question
1 Approved Answer
A chemist carried out an auto-catalytic reaction in a batch reactor and collected data on reaction rates at different concentrations of the reactant during the
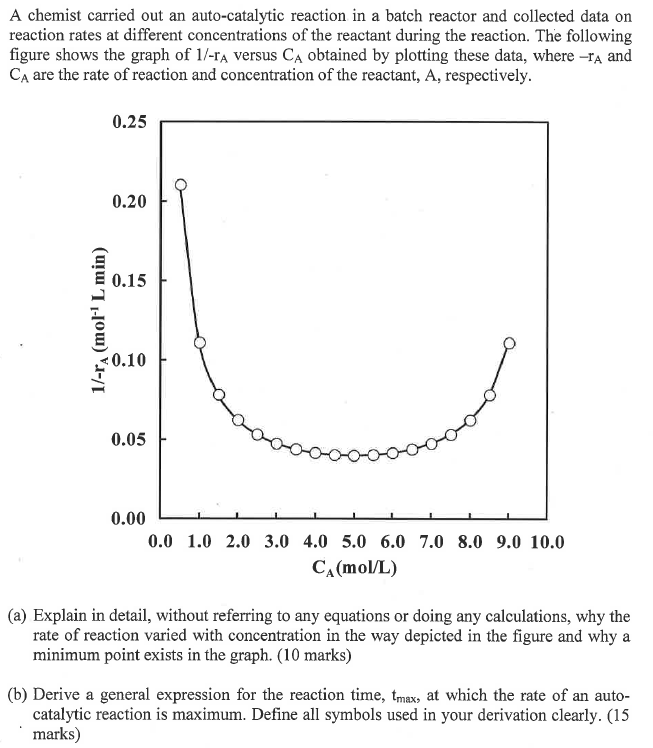
A chemist carried out an auto-catalytic reaction in a batch reactor and collected data on reaction rates at different concentrations of the reactant during the reaction. The following figure shows the graph of 1/rA versus CA obtained by plotting these data, where rA and CA are the rate of reaction and concentration of the reactant, A, respectively. (a) Explain in detail, without referring to any equations or doing any calculations, why the rate of reaction varied with concentration in the way depicted in the figure and why a minimum point exists in the graph. (10 marks) (b) Derive a general expression for the reaction time, tmax, at which the rate of an autocatalytic reaction is maximum. Define all symbols used in your derivation clearly. (15 marks)
Step by Step Solution
There are 3 Steps involved in it
Step: 1
Get Instant Access to Expert-Tailored Solutions
See step-by-step solutions with expert insights and AI powered tools for academic success
Step: 2
Step: 3
Ace Your Homework with AI
Get the answers you need in no time with our AI-driven, step-by-step assistance
Get Started