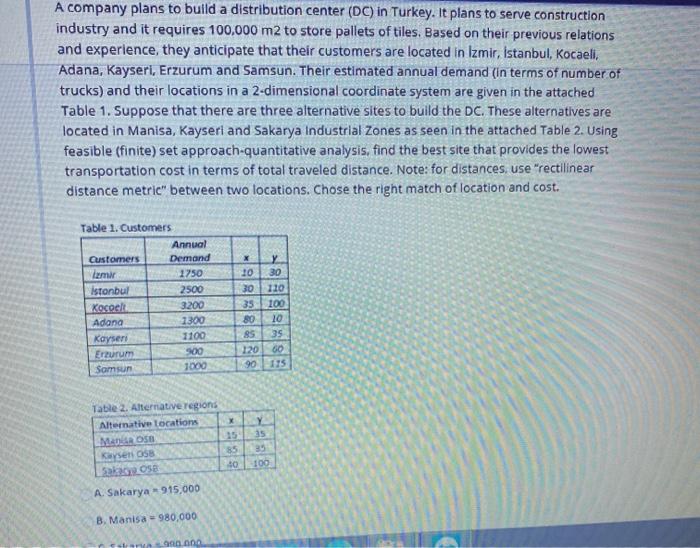
A company plans to build a distribution center (DC) in Turkey. It plans to serve construction industry and it requires 100.000 m2 to store pallets of tiles. Based on their previous relations and experience, they anticipate that their customers are located in Izmir, stanbul, Kocaeli, Adana, Kayseri, Erzurum and Samsun. Their estimated annual demand (in terms of number of trucks) and their locations in a 2-dimensional coordinate system are given in the attached Table 1. Suppose that there are three alternative sites to build the DC. These alternatives are located in Manisa, Kayseri and Sakarya Industrial Zones as seen in the attached Table 2. Using feasible (finite) set approach-quantitative analysis, find the best site that provides the lowest transportation cost in terms of total traveled distance. Note: for distances, use "rectilinear distance metric" between two locations. Chose the right match of location and cost. Table 1. Customers Annual Customers Demand temir 1750 istanbul 2500 Kocoek 3200 Adana 1300 Kayseri 1100 Erzurum 900 Samsun 1000 10 30 35 80 85 30 110 100 10 35 60 115 90 Table 2. Alternative regions Alternative locations Mana on Kayseri OSB 85 Sale OSB 40 Y 35 35 100 A. Sakarya - 915,000 B. Manisa 980,000 non A company plans to build a distribution center (DC) in Turkey. It plans to serve construction industry and it requires 100.000 m2 to store pallets of tiles. Based on their previous relations and experience, they anticipate that their customers are located in Izmir, stanbul, Kocaeli, Adana, Kayseri, Erzurum and Samsun. Their estimated annual demand (in terms of number of trucks) and their locations in a 2-dimensional coordinate system are given in the attached Table 1. Suppose that there are three alternative sites to build the DC. These alternatives are located in Manisa, Kayseri and Sakarya Industrial Zones as seen in the attached Table 2. Using feasible (finite) set approach-quantitative analysis, find the best site that provides the lowest transportation cost in terms of total traveled distance. Note: for distances, use "rectilinear distance metric" between two locations. Chose the right match of location and cost. Table 1. Customers Annual Customers Demand temir 1750 istanbul 2500 Kocoek 3200 Adana 1300 Kayseri 1100 Erzurum 900 Samsun 1000 10 30 35 80 85 30 110 100 10 35 60 115 90 Table 2. Alternative regions Alternative locations Mana on Kayseri OSB 85 Sale OSB 40 Y 35 35 100 A. Sakarya - 915,000 B. Manisa 980,000 non