A complete answer must state the interest of the question, define the variables involved, describe the groups (if applicable), name the test(s) used to analyse the data, report the statistical results e.g., t(45) = 3.50, p
The answer should have the following:
- State the interest of the question - Define the variables e.g. students stress scores (STRESS) were - Describe the groups (range of scores & number in each, M & SD if applicable) - Name the test used - Report the statistical result (2 decimal places, APA formatted- symbols in italics!). Frequencies are reported in whole numbers. - Concluding/summarizing statement- interpret the results in words. What does it mean?
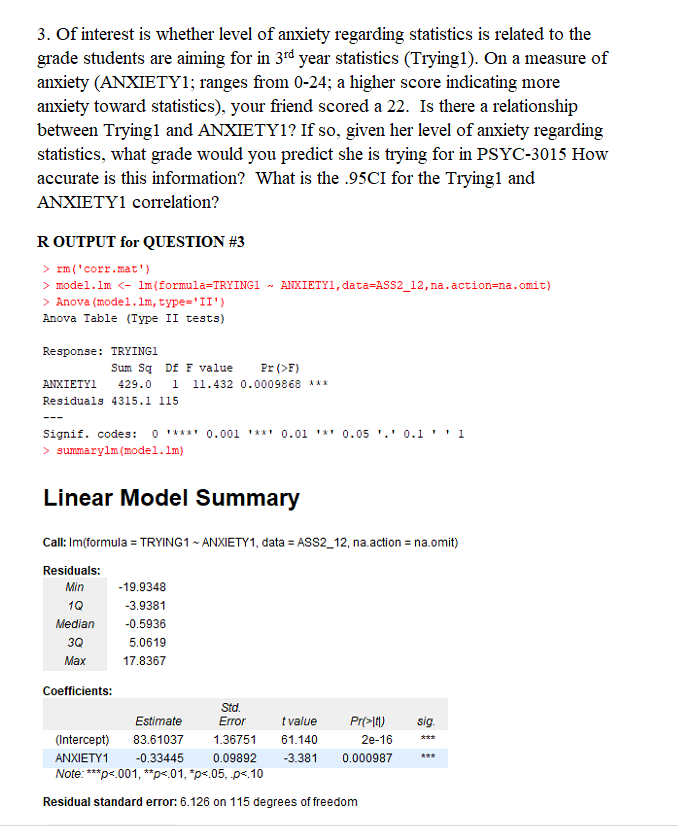
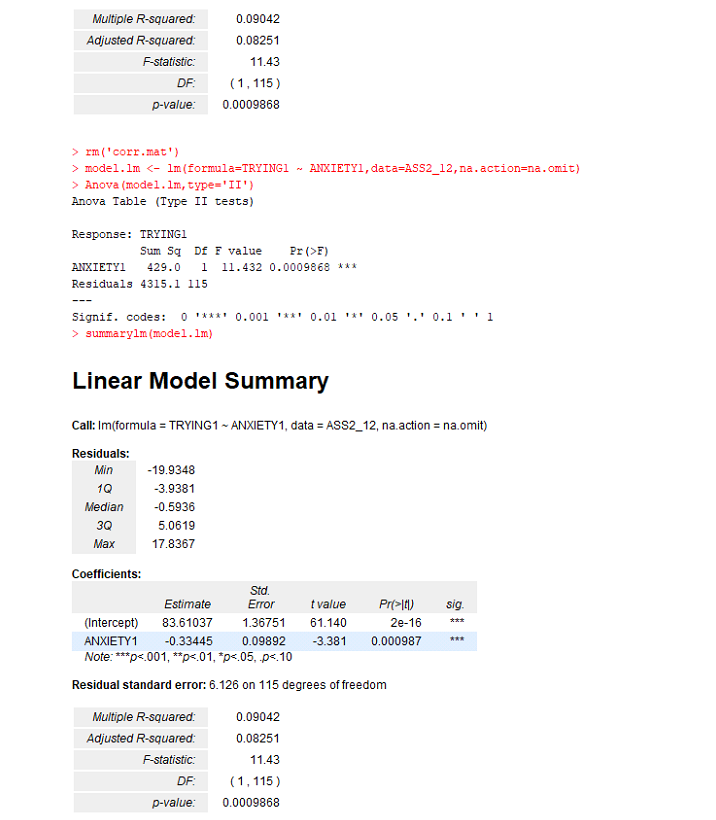
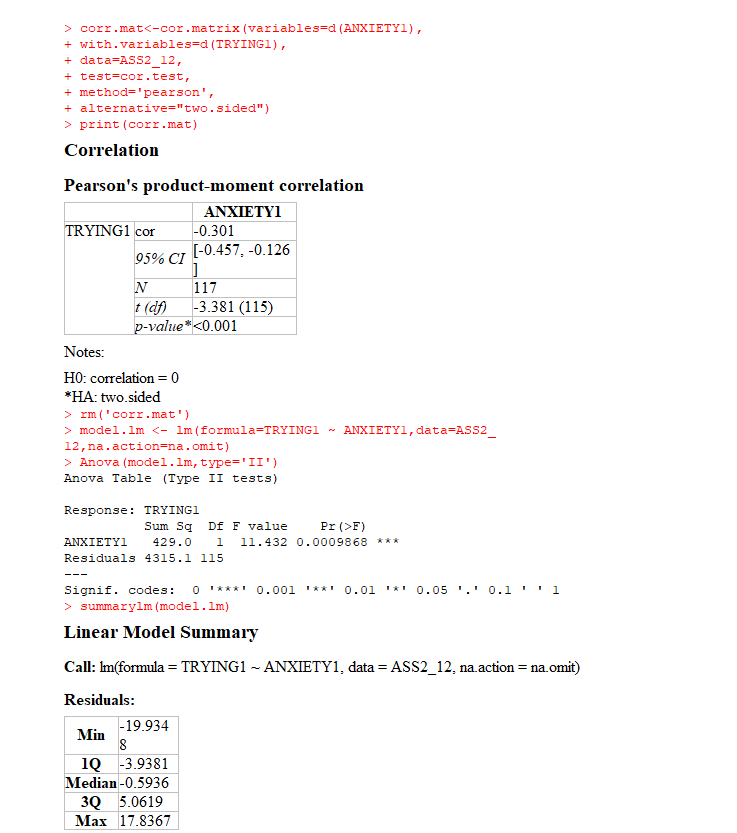
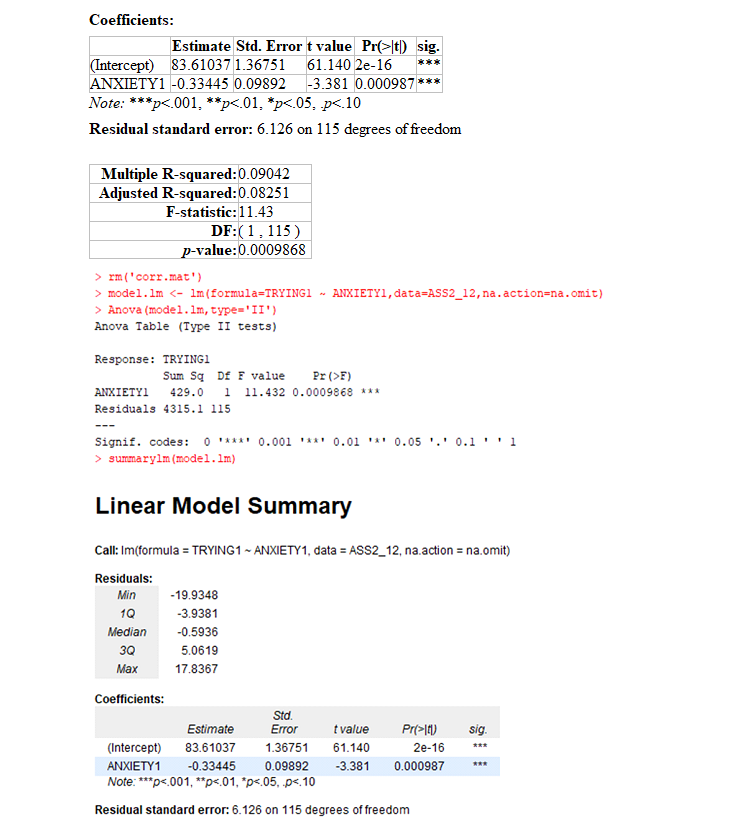
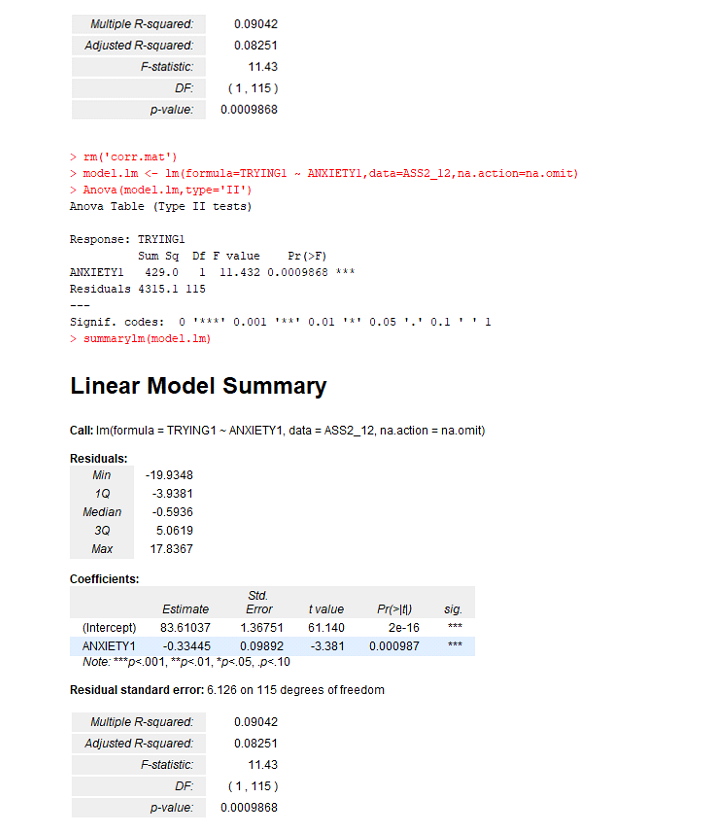
3. Of interest is whether level of anxiety regarding statistics is related to the grade students are aiming for in 3rd year statistics (Trying1). On a measure of anxiety (ANXIETY1; ranges from 0-24; a higher score indicating more anxiety toward statistics), your friend scored a 22. Is there a relationship between Trying1 and ANXIETY1? If so, given her level of anxiety regarding statistics, what grade would you predict she is trying for in PSYC-3015 How accurate is this information? What is the 95CI for the Tryingi and ANXIETY1 correlation? ROUTPUT for QUESTION #3 > mm('corr.mat) > model.lm Anova (model. lm, type='II') Anova Table (Type II tests) Response: TRYINGI Sum Sq DE F value Pr (>F) ANXIETYI 429.0 1 11.432 0.0009868 *** Residuals 4315.1 115 Signif. codes: 0 "***" 0.001 ***1 0.01 '*' 0.05 '.' 0.1''i > summarylm (model.lm) Linear Model Summary Call: Im(formula = TRYING1 - ANXIETY1, data = ASS2_12, na.action = na.omit) Residuals: Min 10 Median 3Q - 19.9348 -3.9381 -0.5936 5.0619 17.8367 Max sig. Coefficients: Std. Estimate Error (Intercept) 83.61037 1.36751 ANXIETY1 -0.33445 0.09892 Note: ***p<.001 p t value pr>141) 2e-16 0.000987 *** Residual standard error: 6.126 on 115 degrees of freedom 0.09042 0.08251 Multiple R-squared: Adjusted R-squared: statistic: DF: p-value: 11.43 (1, 115 ) 0.0009868 > mm ('corr.mat") > model.lm Anova (model.1m, type='II') Anova Table (Type II tests) Response: TRYINGI Sum SQ DE F value Pr (>F) ANXIETYI 429.0 1 11.432 0.0009868 *** Residuals 4315.1 115 Signif. codes: O "***" 0.001 '**' 0.01 '*' 0.05'.' 0.1''i > summarylm (model. lm) Linear Model Summary Call: Im(formula = TRYING1 - ANXIETY1, data = ASS2_12, na.action = na.omit) Residuals: Min - 19.9348 -3.9381 Median -0.5936 30 5.0619 Max 17.8367 10 Pri>IM) sig. Coefficients: Std. Estimate Error (Intercept) 83.61037 1.36751 ANXIETY1 -0.33445 0.09892 Note: ***p<.001 t value residual standard error: on degrees of freedom multiple r-squared: adjusted statistic df p-value:> corr.mat print (corr.mat) Correlation Pearson's product-moment correlation ANXIETY1 TRYING1 cor -0.301 (-0.457,-0.126 95% CI ] N 117 t (df) -3.381 (115) p-value* rm ('corr.mat') > model. Im Anova (model.lm, type='II') Anova Table (Type II tests) Response: TRYINGI Sum sa DE F value Pr (>F) ANXIETY1 429.0 1 11.432 0.0009868 *** Residuals 4315.1 115 O *** Signif. codes: 0.001 '**' 0.01 '*' 0.05 '.' 0.1''i > summarylm (model. lm) Linear Model Summary Call: Im(formula = TRYING1 ANXIETY1, data = ASS2_12, na action=na.omit) Residuals: Min -19.934 8 1Q-3.9381 Median-0.5936 3Q 5.0619 Max 17.8367 Coefficients: Estimate Std. Error t value Pr(>ltl) sig. (Intercept) 83.61037 1.36751 61.140 2e-16 ANXIETY1 -0.33445 0.09892 -3.381 0.000987*** Note: ***p<.001 p residual standard error: on degrees of freedom multiple r-squared:0.09042 adjusted r-squared:0.08251 f-statistic: df: p-value:0.0009868> mm ('corr.mat) > model. Im Anova (model. lm, type='II') Anova Table (Type II tests) Response: TRYINGI Sum SQ DE F value Pr (>F) ANXIETYI 429.0 i 11.432 0.0009868 *** Residuals 4315.1 115 Signif. codes: O "***" 0.001 "**' 0.01 '*' 0.05 '.' 0.1''i > summarylm(model.lm) Linear Model Summary Call: Im(formula = TRYING1 - ANXIETY1, data = ASS2_12, na.action = na.omit) Residuals: Min -19.9348 1Q -3.9381 Median -0.5936 5.0619 Max 17.8367 sig. Coefficients: Std. Estimate Error t value Pr(>10 (Intercept) 83.61037 1.36751 61.140 2e-16 ANXIETY1 -0.33445 0.09892 -3.381 0.000987 Note: ***p<.001 residual standard error: on degrees of freedom multiple r-squared: adjusted f-statistic: df: p-value: anxiety1 data="ASS2_12,na.action=na.omit)"> mm("corr.mat') > model.lm Anova (model.lm, type='II') Anova Table (Type II tests) Response: TRYINGI Sum Sa D F value Pr (>F) ANXIETYI 429.0 1 11.432 0.0009868 *** Residuals 4315.1 115 Signif. codes: O ***** 0.001 *** 0.01 "*" 0.05 '.' 0.1''i > summarylm (model. lm) Linear Model Summary Call: Im(formula = TRYING1 - ANXIETY1, data = ASS2_12, na.action = na.omit) Residuals: Min - 19.9348 10 -3.9381 Median -0.5936 30 5.0619 Max 17.8367 sig Coefficients: Std. Estimate Error t value Pr(>10) (Intercept) 83.61037 1.36751 61.140 2e-16 ANXIETY1 -0.33445 0.09892 -3.381 0.000987 Note: ***p<.001 p residual standard error: on degrees of freedom multiple r-squared: adjusted statistic df p-value: interest is whether level anxiety regarding statistics related to the grade students are aiming for in year a measure ranges from higher score indicating more toward your friend scored there relationship between trying1 and anxiety1 if so given her what would you predict she trying psyc-3015 how accurate this information tryingi correlation routput question> mm('corr.mat) > model.lm Anova (model. lm, type='II') Anova Table (Type II tests) Response: TRYINGI Sum Sq DE F value Pr (>F) ANXIETYI 429.0 1 11.432 0.0009868 *** Residuals 4315.1 115 Signif. codes: 0 "***" 0.001 ***1 0.01 '*' 0.05 '.' 0.1''i > summarylm (model.lm) Linear Model Summary Call: Im(formula = TRYING1 - ANXIETY1, data = ASS2_12, na.action = na.omit) Residuals: Min 10 Median 3Q - 19.9348 -3.9381 -0.5936 5.0619 17.8367 Max sig. Coefficients: Std. Estimate Error (Intercept) 83.61037 1.36751 ANXIETY1 -0.33445 0.09892 Note: ***p<.001 p t value pr>141) 2e-16 0.000987 *** Residual standard error: 6.126 on 115 degrees of freedom 0.09042 0.08251 Multiple R-squared: Adjusted R-squared: statistic: DF: p-value: 11.43 (1, 115 ) 0.0009868 > mm ('corr.mat") > model.lm Anova (model.1m, type='II') Anova Table (Type II tests) Response: TRYINGI Sum SQ DE F value Pr (>F) ANXIETYI 429.0 1 11.432 0.0009868 *** Residuals 4315.1 115 Signif. codes: O "***" 0.001 '**' 0.01 '*' 0.05'.' 0.1''i > summarylm (model. lm) Linear Model Summary Call: Im(formula = TRYING1 - ANXIETY1, data = ASS2_12, na.action = na.omit) Residuals: Min - 19.9348 -3.9381 Median -0.5936 30 5.0619 Max 17.8367 10 Pri>IM) sig. Coefficients: Std. Estimate Error (Intercept) 83.61037 1.36751 ANXIETY1 -0.33445 0.09892 Note: ***p<.001 t value residual standard error: on degrees of freedom multiple r-squared: adjusted statistic df p-value:> corr.mat print (corr.mat) Correlation Pearson's product-moment correlation ANXIETY1 TRYING1 cor -0.301 (-0.457,-0.126 95% CI ] N 117 t (df) -3.381 (115) p-value* rm ('corr.mat') > model. Im Anova (model.lm, type='II') Anova Table (Type II tests) Response: TRYINGI Sum sa DE F value Pr (>F) ANXIETY1 429.0 1 11.432 0.0009868 *** Residuals 4315.1 115 O *** Signif. codes: 0.001 '**' 0.01 '*' 0.05 '.' 0.1''i > summarylm (model. lm) Linear Model Summary Call: Im(formula = TRYING1 ANXIETY1, data = ASS2_12, na action=na.omit) Residuals: Min -19.934 8 1Q-3.9381 Median-0.5936 3Q 5.0619 Max 17.8367 Coefficients: Estimate Std. Error t value Pr(>ltl) sig. (Intercept) 83.61037 1.36751 61.140 2e-16 ANXIETY1 -0.33445 0.09892 -3.381 0.000987*** Note: ***p<.001 p residual standard error: on degrees of freedom multiple r-squared:0.09042 adjusted r-squared:0.08251 f-statistic: df: p-value:0.0009868> mm ('corr.mat) > model. Im Anova (model. lm, type='II') Anova Table (Type II tests) Response: TRYINGI Sum SQ DE F value Pr (>F) ANXIETYI 429.0 i 11.432 0.0009868 *** Residuals 4315.1 115 Signif. codes: O "***" 0.001 "**' 0.01 '*' 0.05 '.' 0.1''i > summarylm(model.lm) Linear Model Summary Call: Im(formula = TRYING1 - ANXIETY1, data = ASS2_12, na.action = na.omit) Residuals: Min -19.9348 1Q -3.9381 Median -0.5936 5.0619 Max 17.8367 sig. Coefficients: Std. Estimate Error t value Pr(>10 (Intercept) 83.61037 1.36751 61.140 2e-16 ANXIETY1 -0.33445 0.09892 -3.381 0.000987 Note: ***p<.001 residual standard error: on degrees of freedom multiple r-squared: adjusted f-statistic: df: p-value: anxiety1 data="ASS2_12,na.action=na.omit)"> mm("corr.mat') > model.lm Anova (model.lm, type='II') Anova Table (Type II tests) Response: TRYINGI Sum Sa D F value Pr (>F) ANXIETYI 429.0 1 11.432 0.0009868 *** Residuals 4315.1 115 Signif. codes: O ***** 0.001 *** 0.01 "*" 0.05 '.' 0.1''i > summarylm (model. lm) Linear Model Summary Call: Im(formula = TRYING1 - ANXIETY1, data = ASS2_12, na.action = na.omit) Residuals: Min - 19.9348 10 -3.9381 Median -0.5936 30 5.0619 Max 17.8367 sig Coefficients: Std. Estimate Error t value Pr(>10) (Intercept) 83.61037 1.36751 61.140 2e-16 ANXIETY1 -0.33445 0.09892 -3.381 0.000987 Note: ***p<.001 p residual standard error: on degrees of freedom multiple r-squared: adjusted statistic df p-value:>


