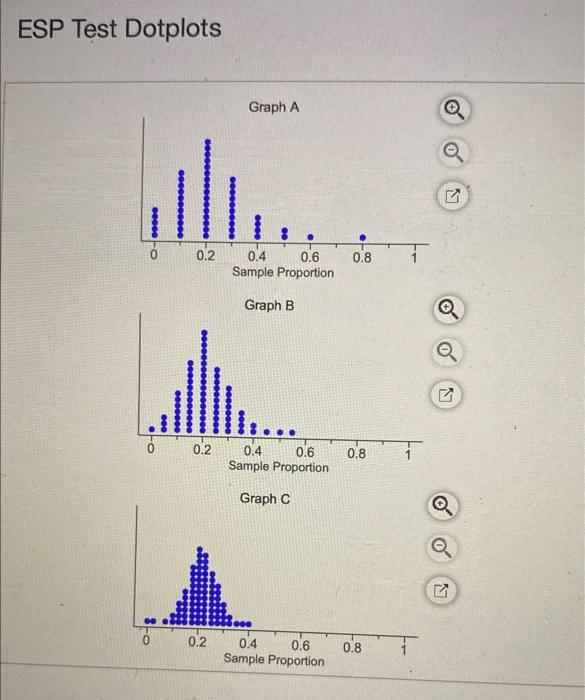
A cortin dock of cards has cards that show one of tive diffecent shapes with equal representaton, so that the probabing of solecting any parililar shape is 0.20: A cavd is selected randomly, and a person is akked so guess which card has been chosen. The attached grophs show a computer simblation of experiments in which a "pechon" was asked to guets which card had been golocted an a largo number of triale. Each dot in the datplots represents the proportion of ouccosses for one person. One dotplot representa an experiment in which oach perich had 10 trials; another shown 20 trials: and a thivd shows 40 trials. Explain how you can bet, from the widths of the graphs, which has the largest sarmple (n =40) and which has the amalleat sampie (n = to) L. Cick the loon 10 view the dotplots. Graph has the largest sample sure because it has the of the twee graphs. Craph has the smalest sample wite because in has the graphs of the throe ESP Test Dotplots A certain deck of cards has cards that show o person is asked to guess which card has bee large number of trials. Each dot in the dotplot 20 trials; and a third shows 40 trials. Explain Click the icon to view the dotplots. Graph has the largest sample size beca presents the proportion of successes for one per: you can tell, from the widths of the graphs, which has the smallest sampl any particular shape is 0.20. A card is selected randomly, and "person" was asked to guess which card had been selected in a periment in which each person had 10 trials; another shows nd which has the smallest sample (n=10). mple size because it has the of the three A certain deck of cards has cards that show one of five different shapes with equal representation, so that the probability of selecting any partic person is asked to guess which card has been chosen. The attached graphs show a computer simulation of experiments in which a "person" v large number of thats. Each dot in the dotplots represents the proportion of successes for one person. One dotplot represents an experiment is 20 trials; and a third shows 40 trials. Explain how you can tell, from the widths of the graphs, which has the largest sample (n=40) and which Click the icon to view the dotplots. Graph has the largest sample size because it has the of the three graphs. Graph graphs. how one of five difierent shapes with equal representation, so that the probability of selecting any particular shape is 0.20 . A card is selected randomly, and a s been chosen. The attached graphs show a computer simulation of experiments in which a "person" was asked to guess which card had been selected in a otplots represents the proportion of sucoesses for one person. One dotplot represents an experiment in which each person had 10 trials; another shows phain how you can tnll from the widths of the graphs, which has the largest sample (n=40) and which has the smallest 9ample (n =10). becsase it has the of the three graphs, Graph has the smallest sample size because it has the of the three

