

Question
a) Draw the graph for the price of a European 1-year 5-strike call option as a function of the current stock price, So. b) Draw
a) Draw the graph for the price of a European 1-year 5-strike call option as a function of the current stock price, So.
b) Draw the graph for the price of an American 6-month 10-strike put option as a function of the current stock price, So.
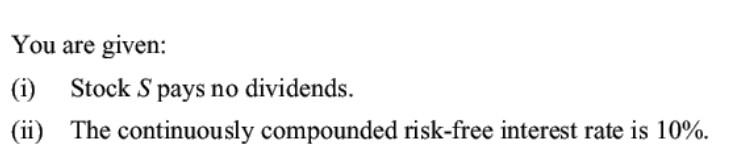
You are given: (i) Stock S pays no dividends. (ii) The continuously compounded risk-free interest rate is 10%. You are given: (i) Stock S pays no dividends. (ii) The continuously compounded risk-free interest rate is 10%Step by Step Solution
There are 3 Steps involved in it
Step: 1

Get Instant Access to Expert-Tailored Solutions
See step-by-step solutions with expert insights and AI powered tools for academic success
Step: 2

Step: 3
Ace Your Homework with AI
Get the answers you need in no time with our AI-driven, step-by-step assistance
Get Started
The Little Book Of Market Myths: How To Profit By Avoiding The Investing Mistakes Everyone Else Makes
Authors: Kenneth L. Fisher
1st Edition
1118445015, 978-1118445013