

Answered step by step
Verified Expert Solution
Question
1 Approved Answer
(a) Figure Q1(a) is plotted using MATLAB to differentiate between a continuous-time signal and a discrete-time signal. Write a script to plot the two figures
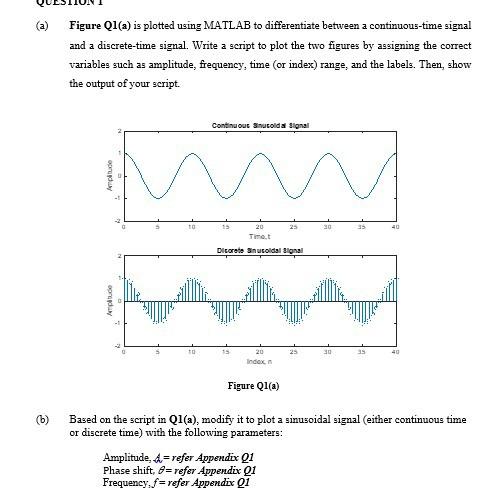
(a) Figure Q1(a) is plotted using MATLAB to differentiate between a continuous-time signal and a discrete-time signal. Write a script to plot the two figures by assigning the correct variables such as amplitude, frequency, time (or index) range, and the labels. Then, show the output of your script. Continuous Sinucolda Signal Amplitude TO 15 25 30 35 20 20 Timet Dicorete Sinusoidal dlgnal pude to 15 25 30 35 20 Index Figure Q1(a) (b) Based on the script in Q1(a), modify it to plot a sinusoidal signal (either continuous time or discrete time) with the following parameters: Amplitude, 4=refer Appendix Q1 Phase shift, 8=refer Appendix Q1 Frequency: f=refer Appendix Q1 (a) Figure Q1(a) is plotted using MATLAB to differentiate between a continuous-time signal and a discrete-time signal. Write a script to plot the two figures by assigning the correct variables such as amplitude, frequency, time (or index) range, and the labels. Then, show the output of your script. Continuous Sinucolda Signal Amplitude TO 15 25 30 35 20 20 Timet Dicorete Sinusoidal dlgnal pude to 15 25 30 35 20 Index Figure Q1(a) (b) Based on the script in Q1(a), modify it to plot a sinusoidal signal (either continuous time or discrete time) with the following parameters: Amplitude, 4=refer Appendix Q1 Phase shift, 8=refer Appendix Q1 Frequency: f=refer Appendix Q1
Step by Step Solution
There are 3 Steps involved in it
Step: 1

Get Instant Access to Expert-Tailored Solutions
See step-by-step solutions with expert insights and AI powered tools for academic success
Step: 2

Step: 3
Ace Your Homework with AI
Get the answers you need in no time with our AI-driven, step-by-step assistance
Get Started
Focus On Geodatabases In ArcGIS Pro
Authors: David W. Allen
1st Edition
1589484452, 978-1589484450