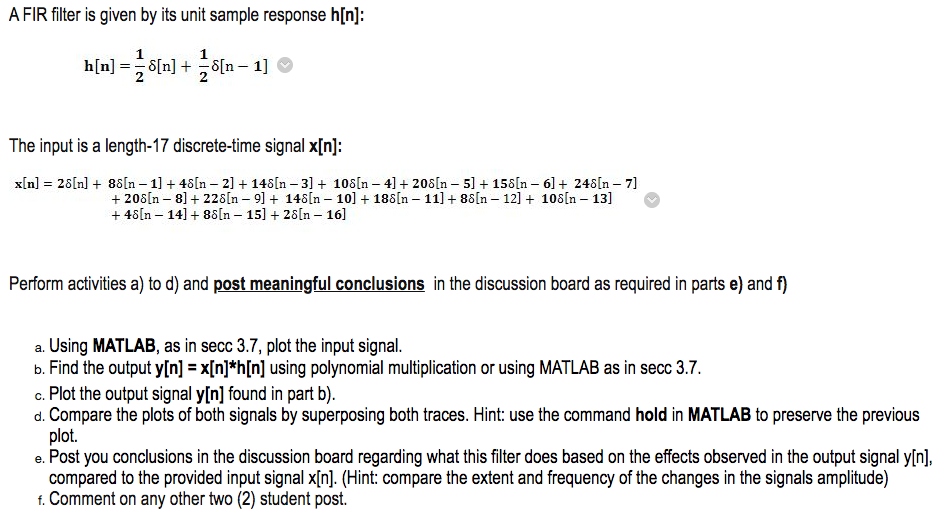
A FIR filter is given by its unit sample response h[n]: h[n] = $[n] + 2o[n 1] The input is a length-17 discrete-time signal x[n]: x[n] = 25[n] + 85[n - 1] + 45[n - 2] + 145[n 3] + 105[n 4]+ 205[n 5] + 155[n 6] + 245[n - 7] + 206[n - 8] + 228[n - 9] + 148[n - 10] + 188[n - 11] +88[n - 12] + 108[n - 13] + 48[n - 14] + 88[n - 15] + 28[n - 16] Perform activities a) to d) and post meaningful conclusions in the discussion board as required in parts e) and f) a. Using MATLAB, as in secc 3.7, plot the input signal. b. Find the output y[n] = x[n]*h[n] using polynomial multiplication or using MATLAB as in secc 3.7. c. Plot the output signal y[n] found in part b). d. Compare the plots of both signals by superposing both traces. Hint: use the command hold in MATLAB to preserve the previous plot. e. Post you conclusions in the discussion board regarding what this filter does based on the effects observed in the output signal y[n], compared to the provided input signal x[n]. (Hint: compare the extent and frequency of the changes in the signals amplitude) f. Comment on any other two (2) student post. A FIR filter is given by its unit sample response h[n]: h[n] = $[n] + 2o[n 1] The input is a length-17 discrete-time signal x[n]: x[n] = 25[n] + 85[n - 1] + 45[n - 2] + 145[n 3] + 105[n 4]+ 205[n 5] + 155[n 6] + 245[n - 7] + 206[n - 8] + 228[n - 9] + 148[n - 10] + 188[n - 11] +88[n - 12] + 108[n - 13] + 48[n - 14] + 88[n - 15] + 28[n - 16] Perform activities a) to d) and post meaningful conclusions in the discussion board as required in parts e) and f) a. Using MATLAB, as in secc 3.7, plot the input signal. b. Find the output y[n] = x[n]*h[n] using polynomial multiplication or using MATLAB as in secc 3.7. c. Plot the output signal y[n] found in part b). d. Compare the plots of both signals by superposing both traces. Hint: use the command hold in MATLAB to preserve the previous plot. e. Post you conclusions in the discussion board regarding what this filter does based on the effects observed in the output signal y[n], compared to the provided input signal x[n]. (Hint: compare the extent and frequency of the changes in the signals amplitude) f. Comment on any other two (2) student post


